A) their joint total cost of abatement is at a maximum.
B) their joint total cost of abatement is at a minimum.
C) Firm A should abate more and Firm B should abate less.
D) Firm B should abate more and Firm A should abate less.
E) the socially optimal joint level of abatement is not being achieved.
Correct Answer

verified
Correct Answer
verified
Multiple Choice
The optimal amount of pollution abatement is generally less than 100%.Complete (100% ) abatement would be optimal if
A) the marginal benefit of abatement is zero.
B) the marginal cost of abatement is positive but less than the marginal benefit of abatement.
C) the marginal cost of abatement exceeds the marginal benefit of abatement at all levels of abatement.
D) the marginal cost of abatement is always zero.
E) none of the above - we cannot even imagine a situation in which complete abatement would be optimal.
Correct Answer

verified
Correct Answer
verified
Multiple Choice
As a method of pollution control,tradable emissions permits,or "cap and trade,"
A) are more effective than emissions taxes when pollution is hard to measure.
B) allow pollution to continue unabated,but only at a huge price to polluting firms.
C) are not a morally acceptable method of pollution control.
D) are an example of paternalistic social regulation.
E) have the advantage of decentralized decision making (like emissions taxes) while also setting the maximum permissible level of pollution (like direct controls) .
Correct Answer

verified
Correct Answer
verified
Multiple Choice
The diagram below shows the marginal cost of pollution abatement for two firms,Firm X and Firm Y.
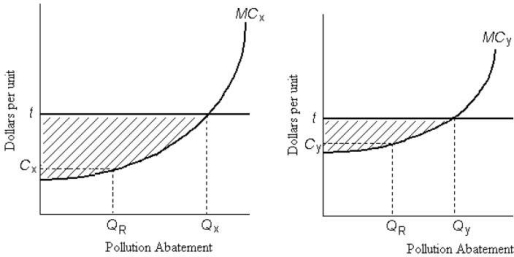 FIGURE 17- 4
-Refer to Figure 17- 4.Ignore the horizontal line at t.Suppose Firms X and Y are each abating QR units of pollution.If Firm X then reduces pollution by one unit and Firm Y increases pollution by one unit,then
A) the total cost of abatement remains the same but pollution falls.
B) total pollution remains the same but the total cost of abatement falls.
C) the total costs of abatement and the amount of pollution do not change.
D) total pollution remains the same but the total cost of abatement increases.
E) the total cost of abatement remains the same but pollution increases.
Correct Answer

verified
Correct Answer
verified
Multiple Choice
Consider the following equation: GHG = GHG × Energy × GDP, Energy GDP Where GHG = world annual emissions of greenhouse gases Energy = world annual amount of energy consumed GDP = world's annual gross domestic product Suppose GHG emissions decreased by 6% between 2012 and 2014,a period when GDP increased by 4% and Energy/GDP decreased by 2%.We can conclude that GHG over the same period Energy
A) remains unchanged.
B) decreased by 8%.
C) decreased by 6%.
D) decreased by 4%.
E) increased by 4%.
Correct Answer

verified
Correct Answer
verified
Multiple Choice
The figure below shows the demand and supply curves for pollution abatement.
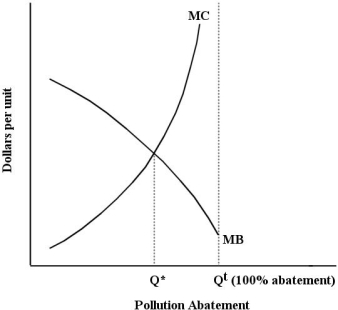 FIGURE 17- 3
-The socially optimal level of output of any good is the quantity where all marginal costs of production,private plus external,equal the
A) average benefit to society.
B) marginal benefit to society.
C) total benefit to society.
D) marginal cost of production.
E) marginal benefit to the firm.
Correct Answer

verified
Correct Answer
verified
Multiple Choice
Zero environmental damage is probably
A) technologically possible but not economically efficient.
B) economically efficient but not technologically possible.
C) technologically possible and economically efficient.
D) neither technologically possible nor economically efficient.
E) necessary if the human race is to survive.
Correct Answer

verified
Correct Answer
verified
Multiple Choice
The diagram below shows the private and social marginal costs (MCP and MCS) and the social marginal benefits (MBS) of producing disposable diapers.
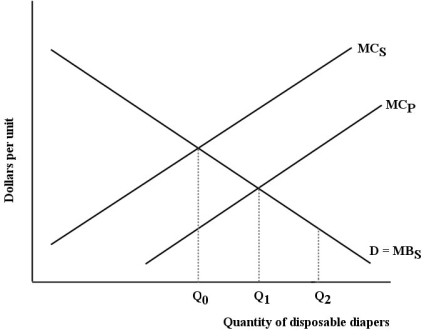 FIGURE 17- 2
-Refer to Figure 17- 2.The net social benefit derived from the production and use of disposable diapers is
A) zero at Q0,because that is where MCS equals MBS.
B) at a minimum at Q0,because MCS exceeds MCP.
C) zero at Q2,because that is where the externality is internalized.
D) at a maximum at Q1,because that is where MCS equals MBS.
E) at a maximum at Q0,because that is where MCS equals MBS.
Correct Answer

verified
Correct Answer
verified
Multiple Choice
The figure below shows the marginal benefit to consumers,MB,the marginal cost to private firms,MCP,and the marginal cost to society,MCS,at each level of output of some good.
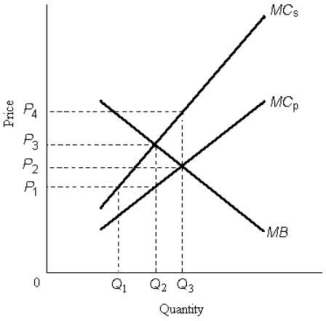 FIGURE 17- 1
-Refer to Figure 17- 1.The equilibrium output that would occur in a competitive market in the absence of government intervention is
A) zero.
B) Q1.
C) Q2.
D) Q3.
E) none of the above; there is no equilibrium output level.
Correct Answer

verified
Correct Answer
verified
Multiple Choice
The diagram below shows the marginal costs of pollution abatement for two firms,Firm 1 and Firm 2.
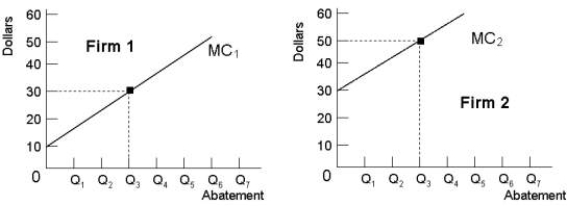 FIGURE 17- 5
-Refer to Figure 17- 5.If the government requires each firm to abate Q3 units of pollution,the social costs of this abatement
A) would be minimized.
B) could be reduced further if Firm 2 increased abatement and Firm 1 reduced its abatement by the same amount.
C) could be reduced further if Firm 1 increased its abatement and Firm 2 reduced its abatement by the same amount.
D) could be reduced further if each firm was required to abate more.
E) could be reduced further if each firm was allowed to pollute more.
Correct Answer

verified
Correct Answer
verified
Multiple Choice
Global greenhouse- gas (GHG) emission reductions are unlikely to be achieved through GDP reductions because
A) the rise in GDP in rich countries will be greater than the reductions in GDP in poor countries.
B) GDP cannot be reduced.
C) the growth rate of world GDP is negative.
D) the rise in GDP in poor countries will be greater than the reductions in GDP in rich countries.
E) ongoing population growth and per capita income growth are likely to drive GDP upward.
Correct Answer

verified
Correct Answer
verified
Multiple Choice
The optimal amount of pollution abatement is such that
A) there is no remaining pollution.
B) the total benefit of reducing pollution is equal to the total cost of reducing pollution.
C) the marginal social cost of reducing pollution is just equal to the marginal social benefits from doing so.
D) the marginal private cost of reducing pollution is just equal to the profit of the polluting firms.
E) none of the above; there is no optimal amount of pollution abatement.
Correct Answer

verified
Correct Answer
verified
Multiple Choice
Zero pollution is almost surely NOT a desirable social goal because
A) the total benefits of complete pollution elimination will be far greater than the total costs.
B) society benefits by employing people in the "pollution fighting" industry.
C) the marginal benefit is equal to zero.
D) the totals costs of complete pollution elimination will be far greater than the total benefits.
E) the marginal cost is equal to zero.
Correct Answer

verified
Correct Answer
verified
Multiple Choice
Suppose a firm producing roof shingles imposes a negative externality on the surrounding area due to the noxious fumes emitted from the plant.The private marginal cost,social marginal cost and marginal benefit associated with the production of the shingles are given by the following equations: MCP = 5 + 2Q MCS = 10 + 3Q MB = 50 - Q A competitive free market will produce units,at a price of _ per unit.
A) 20; $40
B) 10; $35
C) 20; $25
D) 15; $40
E) 15; $35
Correct Answer

verified
Correct Answer
verified
Multiple Choice
The table below shows the marginal benefit and marginal cost of pollution abatement for an economy. TABLE 17- 1 -An upward- sloping marginal cost curve for pollution abatement means that
A) the marginal benefit of pollution reduction will increase with additional increments of pollution reduction.
B) society views additional increments of pollution reduction as absolutely necessary.
C) additional increments of pollution abatement will yield decreasing benefits.
D) it is impossible to know the benefits from additional increments of pollution reduction.
E) the cost of an extra unit of pollution abatement will increase as the total amount of abatement rises.
Correct Answer

verified
Correct Answer
verified
Multiple Choice
Suppose a competitive market for tradable pollution permits is in equilibrium at p*,with the quantity of permits being set by government policy at Q*.If technological advances reduce the marginal cost of pollution abatement,then
A) the equilibrium price of permits will rise above p*.
B) the equilibrium price of permits will fall below p*.
C) the equilibrium quantity of permits will fall below Q*.
D) the equilibrium quantity of permits will fall above Q*.
E) there will be no change in p* or Q*.
Correct Answer

verified
Correct Answer
verified
Multiple Choice
The diagram below shows the marginal cost of pollution abatement for two firms,Firm X and Firm Y.
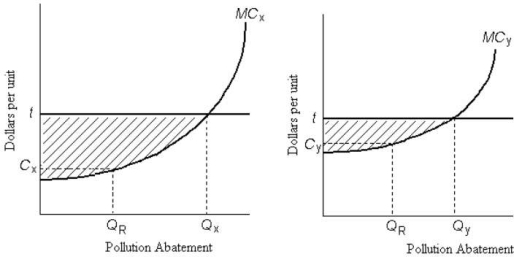 FIGURE 17- 4
-Refer to Figure 17- 4.There is an emissions tax of $t per unit of pollution.The resulting amount of pollution abatement is socially optimal if
A) the emissions tax is equal to the marginal social cost of pollution.
B) the emissions tax causes no change in firms' polluting activity.
C) each firm abates at QR.
D) Firm X abates QX and Firm Y abates QY.
E) each firm pays the maximum amount of tax.
Correct Answer

verified
Correct Answer
verified
Multiple Choice
The figure below shows the marginal benefit to consumers,MB,the marginal cost to private firms,MCP,and the marginal cost to society,MCS,at each level of output of some good. 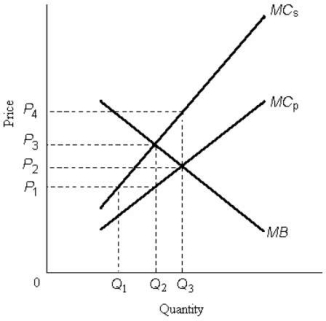 FIGURE 17- 1
-Refer to Figure 17- 1.A negative externality is depicted because the
A) marginal social cost is greater than the marginal social benefit.
B) marginal social cost is greater than the marginal private cost.
C) optimal level of output occurs where marginal private benefit is positive.
D) optimal level of output occurs where marginal private cost is positive.
E) marginal social benefit to consumers is diminishing with greater output.
Correct Answer

verified
Correct Answer
verified
Multiple Choice
Suppose a per- unit tax is imposed on a firm's output which makes the marginal private cost of production equal to the marginal social cost.In this case,we can then say that
A) the externality has been fully internalized for that firm.
B) the firm will make losses as its costs have increased.
C) the firm will be forced by the extra cost burden to leave the industry.
D) the internality has been externalized for that firm.
E) the firm will not make any changes to its output decision.
Correct Answer

verified
Correct Answer
verified
Multiple Choice
Federal regulation aimed at reducing greenhouse- gas emissions by setting some maximum level of emissions from each firm
A) is the best approach because firms will quickly reduce air pollution.
B) will usually not produce the desired reduction in emissions at the lowest possible cost.
C) will achieve the largest but not the most efficient reduction in emissions.
D) will achieve the least reduction in emissions but be the most efficient.
E) is the best approach because the costs of reducing emissions are different for each firm.
Correct Answer

verified
Correct Answer
verified
Showing 41 - 60 of 109
Related Exams