A) an increase in housing prices, especially in cities with plenty of room for expansion.
B) an increase in housing prices, especially in cities with limited land.
C) a decrease in housing prices, especially in cities with plenty of room for expansion.
D) a decrease in housing prices, especially in cities with limited land.
Correct Answer

verified
Correct Answer
verified
Multiple Choice
How would a decline in demand for imported commodities by the Chinese affect the market for cargo transportation to China?
A) Supply of cargo transportation shifts to the right causing an increase in quantity demanded and decline in equilibrium price.
B) Supply of cargo transportation shifts to the right causing an increase in demand and equilibrium quantity and a decrease in equilibrium price.
C) Demand for cargo transportation shifts to the left causing a decline in quantity supplied and price.
D) Demand for cargo transportation shifts to the left causing a decline in supply and equilibrium quantity and price.
Correct Answer

verified
Correct Answer
verified
True/False
A demand curve is downward sloping because as the price of a good falls, demanders will substitute some other good for that good whose price has fallen.
Correct Answer

verified
Correct Answer
verified
Multiple Choice
If supply and demand intersect at a price of $5.00, then a reduction in price from $6.00 to $5.00 will cause an increase in quantity:
A) supplied, a decrease in quantity demanded, and the alleviation of a shortage.
B) demanded, a decrease in quantity supplied, and the alleviation of a shortage.
C) supplied, a decrease in quantity demanded, and the alleviation of a surplus.
D) demanded, a decrease in quantity supplied, and the alleviation of a surplus.
Correct Answer

verified
Correct Answer
verified
Multiple Choice
Which of the following is not held constant as you move along the demand curve?
A) The price of that good
B) The price of other goods
C) The incomes of consumers
D) The preferences of consumers for the good
Correct Answer

verified
Correct Answer
verified
Multiple Choice
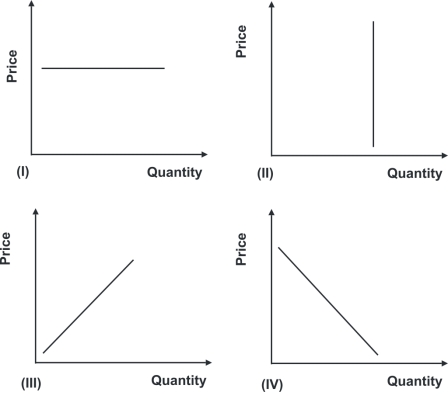
Refer to the graphs shown.If quantity supplied is a fixed amount that does not vary with price, then the supply curve looks like: 
A) I.
B) II.
C) III.
D) IV.
Correct Answer

verified
Correct Answer
verified
Multiple Choice
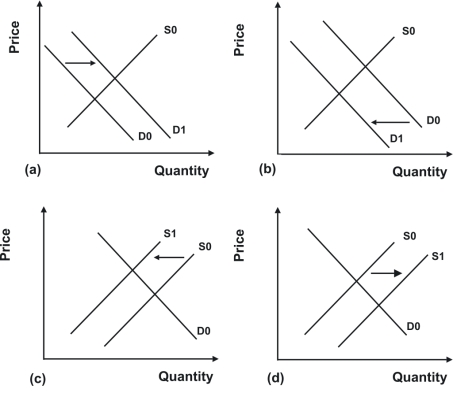
Refer to the graphs shown.The relevant market is corn.The impact of a poor corn harvest on the market for corn would most likely be demonstrated by which graph? 
A) a
B) b
C) c
D) d
Correct Answer

verified
Correct Answer
verified
Multiple Choice
Three hurricanes, combined with the already high real-estate prices, have made people reconsider whether to retire to Florida.The cost of homeownership has increased due to stricter building codes.The influx of retirees is not expected to change because the baby boom generation is approaching retirement age and Florida has long attracted many retirees.Which of the following factors is tending to move the demand curve for Florida housing to the right?
A) The aging of the baby boomers, increasing the number of people who are retiring
B) The increase in the cost of insurance
C) The already high real-estate prices
D) The current high construction costs
Correct Answer

verified
Correct Answer
verified
Multiple Choice
Sometimes price cuts can have an unintended result of consumers waiting for deeper discounts.What does this waiting suggest about supply and demand?
A) The demand curve slopes the wrong way because price cuts have lead to smaller sales.
B) If buyers are buying less when price falls, the supply curve must have moved left.
C) If buyers are buying less when price falls, the supply curve must have moved right.
D) Price cuts have changed buyers' expectations, and the change in expectations has moved the demand curve left.
Correct Answer

verified
Correct Answer
verified
Multiple Choice
Honey and jam are substitute products.If the price of honey increases, the demand for:
A) honey will increase.
B) honey will decrease, causing its price to fall.
C) jam will increase, causing the price of jam to increase as well.
D) jam will decrease, causing the price of jam to fall.
Correct Answer

verified
Correct Answer
verified
Multiple Choice
Suppose the given supply and demand tables reflect the supply and demand for milk per week.At a price of $1, there is a: 
A) surplus of 500 gallons per week.
B) surplus of 1,000 gallons per week.
C) shortage of 2,500 gallons per week.
D) shortage of 1,000 gallons per week.
Correct Answer

verified
Correct Answer
verified
True/False
An increase in demand causes equilibrium price and quantity to rise, other things constant.
Correct Answer

verified
Correct Answer
verified
Multiple Choice
The law of supply states that, other things equal, as the price of a good goes:
A) up, the quantity supplied goes up.
B) up, the supply goes down.
C) down, the quantity supplied goes up.
D) down, the supply goes down.
Correct Answer

verified
Correct Answer
verified
True/False
According to the law of demand, only the price of a good influences the amount people will choose to purchase.
Correct Answer

verified
Correct Answer
verified
Multiple Choice
In Operation Desert Storm, oil facilities in Iraq were attacked amid strong demand for oil.In response, political pressure motivated OPEC to increase the daily quota by 2 million barrels a day.Assuming demand did not change, which of the following series of prices most likely matches how the price of a barrel of oil changed from (1) before the attack, to (2) just after the attack, to (3) after OPEC increased the quota?
A) $42, $38, $40
B) $38, $40, $42
C) $42, $40, $38
D) $40, $42, $38
Correct Answer

verified
Correct Answer
verified
Multiple Choice
Which of the following would cause quantity demanded to change without changing the demand curve?
A) A change in income
B) A change in the price of the good
C) Achange in tastes and preferences
D) Achange in the price of a substitute good
Correct Answer

verified
Correct Answer
verified
Multiple Choice
Suppose the supply and demand tables shown reflect the supply and demand for milk per week.What is the equilibrium price and quantity of milk? 
A) $1 per gallon and 2,000 gallons per week.
B) $2 per gallon and 1,500 gallons per week.
C) $3 per gallon and 2,000 gallons per week.
D) $4 per gallon and 2,000 gallons per week.
Correct Answer

verified
Correct Answer
verified
Multiple Choice
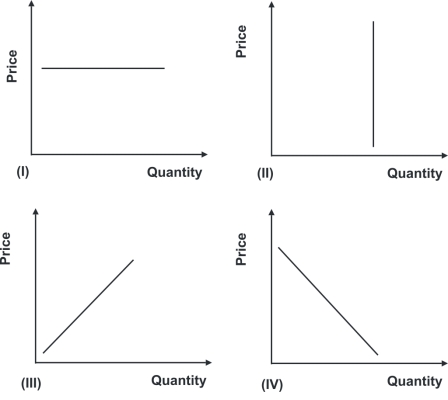
Refer to the graphs shown.The curve that best demonstrates the law of demand is: 
A) I.
B) II.
C) III.
D) IV.
Correct Answer

verified
Correct Answer
verified
Multiple Choice
Suppose the supply and demand tables shown reflect the supply and demand for milk per week.At a price of $4, there is a: 
A) surplus of 1,000 gallons per week.
B) surplus of 2,000 gallons per week.
C) shortage of 1,000 gallons per week.
D) shortage of 2,000 gallons per week.
Correct Answer

verified
Correct Answer
verified
Multiple Choice
The growing popularity of a commercial weight-loss diet that includes reducing the amount of carbohydrates consumed will cause:
A) an increase in the demand for bread.
B) a decrease in the demand for bread.
C) a movement down and to the right along the demand for bread curve.
D) a movement up and to the left along the demand for bread curve.
Correct Answer

verified
Correct Answer
verified
Showing 21 - 40 of 125
Related Exams