A) The demand decreases and the demand curve shifts rightward.
B) The demand increases and the demand curve shifts leftward.
C) The demand increases and the demand curve shifts rightward.
D) The demand decreases and the demand curve shifts leftward.
E) There is no impact on demand for the good and the demand curve does not shift.
Correct Answer

verified
Correct Answer
verified
Multiple Choice
A change in the demand for apples could result from any of the following EXCEPT
A) increased preferences for fresh fruit consumption for health reasons.
B) a change in the number of buyers.
C) a change in income.
D) a change in the price of a banana.
E) a change in the price of an apple.
Correct Answer

verified
Correct Answer
verified
Multiple Choice
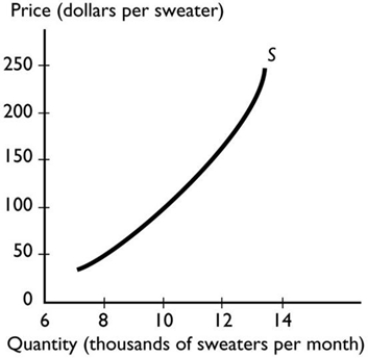 The graph illustrates the supply of sweaters. Which of the following events will increase the supply of sweaters?
A) A rise in the wage rate paid to the workers who make sweaters.
B) A rise in the expected future price of a sweater.
C) An increase in income if sweaters are a normal good.
D) An increase in the number of sellers of sweaters.
E) A rise in the price of a sweater.
Correct Answer

verified
Correct Answer
verified
Multiple Choice
Researchers have found a hybrid of corn that is cheaper to grow. This technological breakthrough
A) increases the demand for corn.
B) decreases the supply of corn.
C) increases the supply of corn.
D) Both answers A and C are correct.
E) Both answers A and B are correct.
Correct Answer

verified
Correct Answer
verified
Multiple Choice
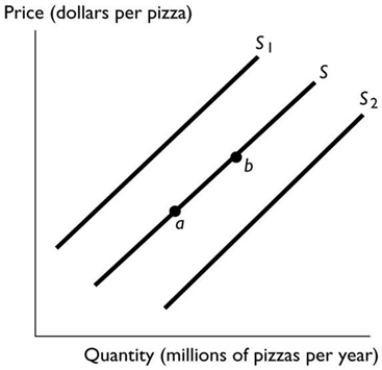 In the above figure, the movement from point a to point b reflects
A) an increase in the number of producers of pizza.
B) a decrease in the cost of the tomato sauce used to produce pizza.
C) a decrease in income if pizza is a normal good.
D) an increase in the supply of pizza.
E) an increase in the price of pizza.
Correct Answer

verified
Correct Answer
verified
Multiple Choice
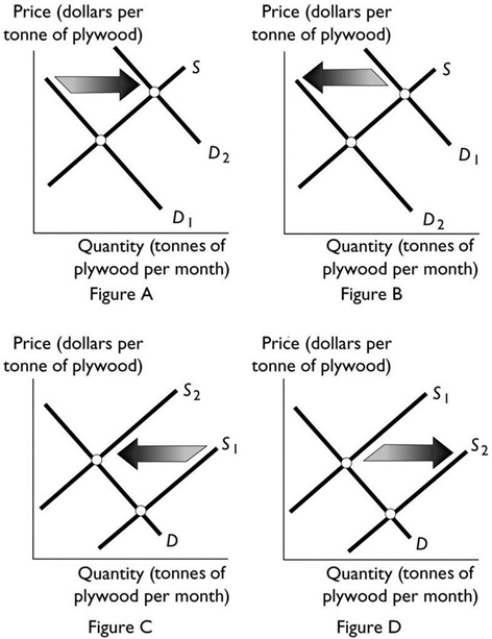 -New technology for producing plywood is developed. Which of the figures above best illustrates this change?
A) Figure A
B) Figure B
C) Figure C
D) Figure D
E) Figure A and Figure D
Correct Answer

verified
Correct Answer
verified
Multiple Choice
Suppose the equilibrium price of movie tickets is $10. If the supply curve for movies shifts ________, the equilibrium price will ________.
A) rightward; increase
B) rightward; decrease
C) leftward; decrease
D) rightward; not change
E) leftward; not change
Correct Answer

verified
Correct Answer
verified
Multiple Choice
The market demand curve for mousetraps is
A) found by summing the prices of mousetraps at each quantity of mousetraps demanded by each buyer.
B) the horizontal sum of the individual demand curves for mousetraps of all the buyers.
C) found by summing the quantities of mousetraps demanded at each income level by each buyer.
D) Both answers B and C are correct.
E) Both answers A and C are correct.
Correct Answer

verified
Correct Answer
verified
Multiple Choice
To be part of the supply for a good, a producer must be
A) both able and willing to supply the good.
B) both able and willing to supply the good, and have already sold the good.
C) only willing to supply the good.
D) only able to supply the good.
E) both able and willing to supply the good, and have already identified a buyer.
Correct Answer

verified
Correct Answer
verified
Multiple Choice
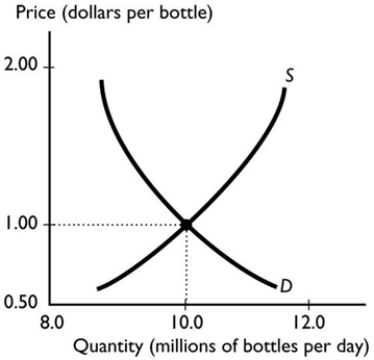 The graph illustrates the market for bottled water. When the price exceeds the equilibrium price, the quantity demanded is ________ the quantity supplied and the price of the good will ________.
A) equal to; fall
B) greater than; fall
C) less than; fall
D) greater than; rise
E) less than; rise
Correct Answer

verified
Correct Answer
verified
Multiple Choice
A competitive market is in equilibrium. Then there is a decrease in demand and a decrease in supply. The equilibrium price ________, and the equilibrium quantity ________.
A) rises; decreases
B) perhaps changes but we can't say if it rises, falls or stays the same; decreases
C) falls; increases
D) rises; increases
E) perhaps changes but we can't say if it rises, falls or stays the same; increases
Correct Answer

verified
Correct Answer
verified
Multiple Choice
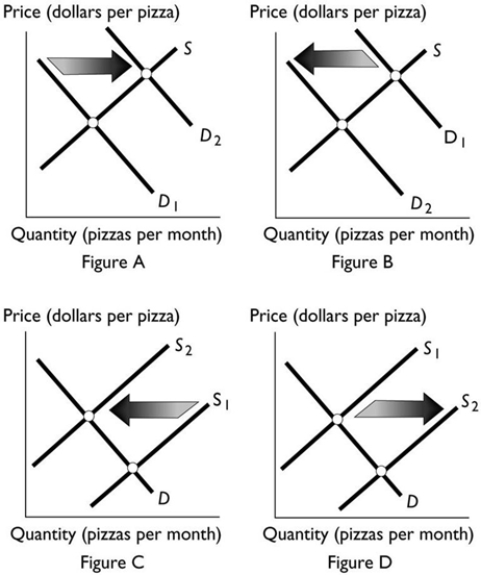 -Which figure above shows the effect if research is published claiming that eating pizza is healthy?
A) Figure A
B) Figure B
C) Figure C
D) Figure D
E) Both Figure A and Figure D
Correct Answer

verified
Correct Answer
verified
Multiple Choice
Which of the following leads to an increase in the quantity supplied, but not an increase in supply?
A) An advance in the technology used to produce the good.
B) An increase in the product's price.
C) A decrease in the costs of production.
D) An increase in the price of another product that the suppliers can produce.
E) An increase in the number of firms producing the good or service.
Correct Answer

verified
Correct Answer
verified
Multiple Choice
Milk can be used to produce cheese or butter. If the price of a kilogram of butter rises, what happens to the supply of cheese?
A) The supply of cheese could increase, decrease or stay the same depending on what happens to the supply of butter.
B) The supply of cheese stays the same, and there is no change in the quantity supplied of cheese.
C) The supply of cheese increases.
D) The supply of cheese decreases.
E) The supply of cheese stays the same, and there is a decrease in the quantity supplied of cheese.
Correct Answer

verified
Correct Answer
verified
Multiple Choice
A normal good is DEFINED as a good
A) for which demand increases when the price of a complement falls.
B) for which demand increases when income increases.
C) with a downward-sloping demand curve.
D) for which demand increases when the number of demanders increases.
E) for which demand increases when the price of a substitute rises.
Correct Answer

verified
Correct Answer
verified
Multiple Choice
If good weather conditions result in a larger than normal crop of peaches, then the
A) increase in the supply of peaches induces a greater demand for peaches, so that the equilibrium price rises and the equilibrium quantity increases.
B) demand curve for peaches shifts leftward.
C) equilibrium price of peaches falls, and the equilibrium quantity of peaches decreases.
D) equilibrium price of peaches rises, and the equilibrium quantity of peaches increases.
E) equilibrium price of peaches falls, and the equilibrium quantity of peaches increases.
Correct Answer

verified
Correct Answer
verified
Multiple Choice
Suppose the current price of a kilogram of steak is $6 per kilogram and the equilibrium price is $9 per kilogram. What takes place?
A) There is a shortage, so the price rises and quantity demanded increases.
B) There is a shortage, so the price rises and quantity demanded decreases.
C) There is a surplus, so the price falls and quantity demanded increases.
D) There is a shortage, so the price falls and quantity demanded increases.
E) There is a shortage, so the price falls and quantity demanded decreases.
Correct Answer

verified
Correct Answer
verified
Multiple Choice
An increase in the number of pineapple growers results in
A) no change in the supply of pineapples and a movement along the supply curve of pineapples.
B) an increase in the supply of pineapples and a leftward shift in the supply curve of pineapples.
C) an increase in the supply of pineapples and a rightward shift in the supply curve of pineapples.
D) an increase in the quantity of pineapples supplied and no shift in the supply curve of pineapples.
E) None of the above answers is correct.
Correct Answer

verified
Correct Answer
verified
Multiple Choice
Bagels and cream cheese are complementary goods. Suppose that the price of flour, which is used to produce bagels, increases. The equilibrium price of CREAM CHEESE ________, and the equilibrium quantity of CREAM CHEESE ________.
A) rises; decreases
B) falls; decreases
C) does not change; does not change
D) rises; increases
E) falls; increases
Correct Answer

verified
Correct Answer
verified
Multiple Choice
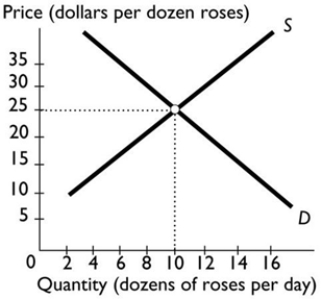 In the figure above, a price of $15 per dozen roses results in
A) equilibrium.
B) an eventual leftward shift of the demand curve and/or rightward shift of the supply curve.
C) a shortage.
D) downward pressure on the price of roses.
E) a surplus.
Correct Answer

verified
Correct Answer
verified
Showing 101 - 120 of 139
Related Exams