A) average propensity to consume falls.
B) average propensity to save falls.
C) volume of consumption declines absolutely.
D) volume of investment diminishes.
Correct Answer

verified
Correct Answer
verified
Multiple Choice
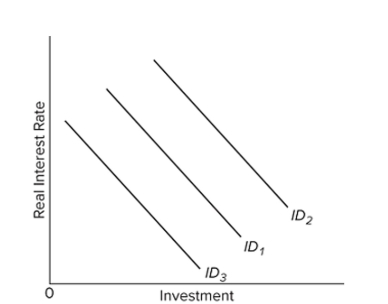 Refer to the diagram. Which of the following would shift the investment demand curve from ID1 to ID2?
A) a lower interest rate
B) lower expected rates of return on investment
C) a higher interest rate
D) higher expected rates of return on investment
Correct Answer

verified
Correct Answer
verified
Multiple Choice
If the real interest rate in the economy is i and the expected rate of return from additional investment is r, then more investment will be forthcoming when
A) r falls.
B) i is greater than r.
C) r is greater than i.
D) i rises.
Correct Answer

verified
Correct Answer
verified
Multiple Choice
The saving schedule is such that as aggregate income increases by a certain amount, saving
A) increases by the same amount as the increase in income.
B) does not change.
C) increases, but by a smaller amount.
D) increases by an even larger amount.
Correct Answer

verified
Correct Answer
verified
Multiple Choice
The investment demand curve suggests that
A) changes in the real interest rate will not affect the amount invested.
B) there is an inverse relationship between the real rate of interest and the level of investment spending.
C) an increase in business taxes will tend to stimulate investment spending.
D) there is a direct relationship between the real rate of interest and the level of investment spending.
Correct Answer

verified
Correct Answer
verified
Multiple Choice
The relationship between consumption and disposable income is such that
A) an inverse and stable relationship exists between consumption and income.
B) a direct, but very volatile, relationship exists between consumption and income.
C) a direct and relatively stable relationship exists between consumption and income.
D) the two are usually equal.
Correct Answer

verified
Correct Answer
verified
Multiple Choice
The investment schedule in the given table indicates that if the real interest rate is 8 percent, then
A) we cannot tell what volume of investment will be pro?table.
B) $30 billion will be both saved and invested.
C) $30 billion of investment will be undertaken.
D) $60 billion of investment will be undertaken.
Correct Answer

verified
Correct Answer
verified
Multiple Choice
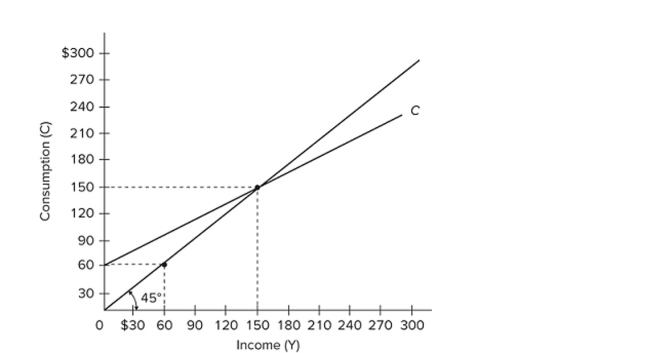 (Advanced analysis) Refer to the diagram. The equation for the consumption schedule is
A) C = 0.6Y.
B) Y = 60 + 0.6C.
C) C = 60 + 0.6Y.
D) C = 60 + 0.4Y.
Correct Answer

verified
Correct Answer
verified
Multiple Choice
At the point where the consumption schedule intersects the 45-degree line,
A) the MPC equals 1.
B) the APC is zero.
C) saving equals income.
D) saving is zero.
Correct Answer

verified
Correct Answer
verified
Multiple Choice
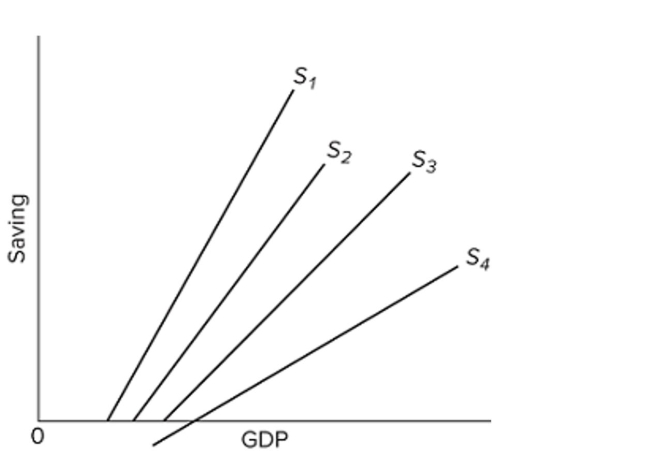 The figure shows the saving schedules for economies 1, 2, 3, and 4. Which economy has the largest multiplier?
A) 1
B) 2
C) 3
D) 4
Correct Answer

verified
Correct Answer
verified
Multiple Choice
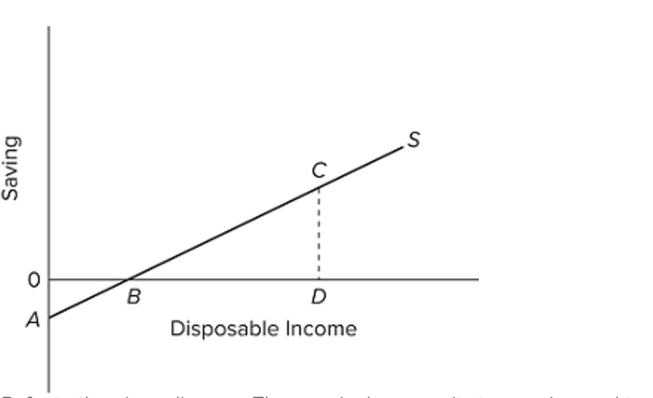 Refer to the given diagram. The marginal propensity to save is equal to
A) CD/0D.
B) 0B/0A.
C) 0A/0D.
D) CD/BD.
Correct Answer

verified
Correct Answer
verified
Multiple Choice
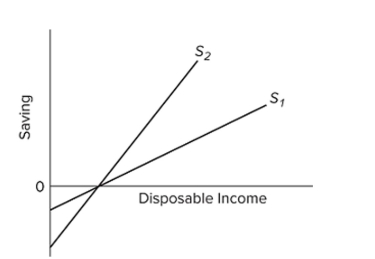 Suppose the economy's saving schedule shifts from S1 to S2, as shown in the given diagram. We can say that its
A) MPC has increased.
B) MPS has increased.
C) APS has increased at all levels of disposable income.
D) APS has decreased at all levels of disposable income.
Correct Answer

verified
Correct Answer
verified
Multiple Choice
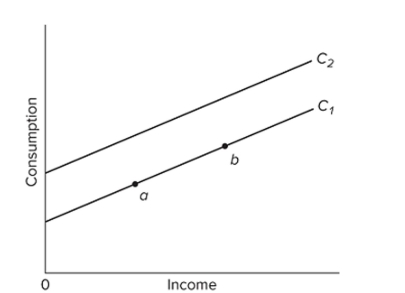 Refer to the given graph. A movement from b to a along C1 might be caused by a(n)
A) recession.
B) wealth effect of an increase in stock market prices.
C) decrease in income tax rates.
D) increase in saving.
Correct Answer

verified
Correct Answer
verified
Multiple Choice
Other things equal, if the real interest rate falls and business taxes rise,
A) investment will rise until it is equal to saving.
B) we will be uncertain as to the resulting change in investment.
C) we can be certain that investment will rise.
D) we can be certain that investment will fall.
Correct Answer

verified
Correct Answer
verified
Multiple Choice
 Refer to the consumption schedule shown in the graph. At income level 3, the amount of saving is represented by the line segment
A) FG.
B) FH.
C) FD.
D) GH.
Correct Answer

verified
Correct Answer
verified
Multiple Choice
If the saving schedule is a straight line, the
A) MPS must be constant.
B) APS must be constant.
C) APC must be constant.
D) MPC must be rising.
Correct Answer

verified
Correct Answer
verified
Multiple Choice
Assume that for the entire business sector of a private closed economy, there are $0 worth of investment projects that will yield an expected rate of return of 25 percent or more. But there are $15 Worth of investments that will yield an expected rate of return of 20-25 percent, another $15 with an Expected rate of return of 15-20 percent, and an additional $15 of investment projects in each Successive rate of return range down to and including the 0-5 percent range. If the real interest rate is 15 percent, what amount of investment will be undertaken?
A) $15
B) $30
C) $45
D) $60
Correct Answer

verified
Correct Answer
verified
Multiple Choice
The investment demand slopes downward and to the right because lower real interest rates
A) expand consumer borrowing, making investments more profitable.
B) boost expected rates of returns on investment.
C) enable more investment projects to be undertaken profitably.
D) create tax incentives to invest.
Correct Answer

verified
Correct Answer
verified
Multiple Choice
In annual percentage terms, investment spending in the United States is
A) less variable than real GDP.
B) less variable than consumption spending.
C) less variable than the price level.
D) more variable than real GDP.
Correct Answer

verified
Correct Answer
verified
Multiple Choice
Assume a machine that has a useful life of only one year costs $2,000. Assume, also, that net of such operating costs as power, taxes, and so forth, the additional revenue from the output of this machine is Expected to be $2,300. The expected rate of return on this machine is
A) 7.5 percent.
B) 10 percent.
C) 15 percent.
D) 20 percent.
Correct Answer

verified
Correct Answer
verified
Showing 201 - 220 of 233
Related Exams