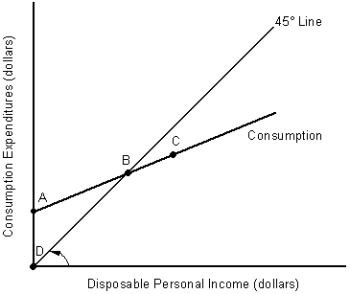
A) the origin of the graph.
B) the point where the consumption function touches the vertical axis.
C) the point where the MPC equals 1.00.
D) the point where the APC equals 1.00.
E) the point where the consumption function crosses the 45-degree line.
Correct Answer

verified
Correct Answer
verified
Multiple Choice
The second-largest component of aggregate expenditures in the United States is _____.
A) consumption.
B) investment
C) government expenditure
D) imports
E) exports
Correct Answer

verified
Correct Answer
verified
Multiple Choice
In the table given below Y represent the aggregate expenditure of the economy on C = consumption, I = investment, G = government projects, and X = net exports. Table 9.3 -According to Table 9.3, what is the marginal propensity to import?
A) -0.20
B) 0.40
C) -0.50
D) 0.75
E) -0.80
Correct Answer

verified
Correct Answer
verified
Multiple Choice
The figure given below shows the consumption function of a household.
Figure 9.2
 -In Figure 9.2, at any point to the left of point B:
A) autonomous consumption is less than zero.
B) saving occurs.
C) disposable income is negative
D) consumption is greater than disposable income.
E) autonomous consumption is zero.
Correct Answer

verified
Correct Answer
verified
Multiple Choice
In the table given below Y represent the aggregate expenditure of the economy on C = consumption, I = investment, G = government projects, and X = net exports. Table 9.3 -Refer to Table 9.3. Compute the marginal propensity to save in the economy.
A) 0.10
B) 0.20
C) 0.25
D) 0.50
E) 0.75
Correct Answer

verified
Correct Answer
verified
Multiple Choice
Identify the correct statement with respect to consumption and saving function.
A) Both the consumption function and the saving function have negative slopes.
B) As disposable income declines, consumption and saving increase.
C) The consumption function has a negative slope while the saving function has a positive slope.
D) As disposable income rises, consumption and saving increase.
E) The consumption function has a positive slope while the saving function has a negative slope.
Correct Answer

verified
Correct Answer
verified
Multiple Choice
What would be the impact of an increase in foreign income on the net export function?
A) The net export function would shift upward.
B) The net export function would shift downward.
C) The slope of the net export function would increase.
D) The slope of the net export function would decrease.
E) There would be a movement up along the net export function.
Correct Answer

verified
B
Correct Answer
verified
True/False
The marginal propensity to consume (MPC) is equal to the inverse of the marginal propensity to save (MPS).
Correct Answer

verified
Correct Answer
verified
True/False
Saving remaining constant, the average propensity to save declines with an increase in disposable income.
Correct Answer

verified
Correct Answer
verified
True/False
An increase in disposable income will cause autonomous consumption to rise.
Correct Answer

verified
Correct Answer
verified
True/False
The consumption function has a positive slope while the savings function has a negative slope.
Correct Answer

verified
Correct Answer
verified
True/False
MPI refers to the percentage of additional domestic income spent on imports.
Correct Answer

verified
Correct Answer
verified
Multiple Choice
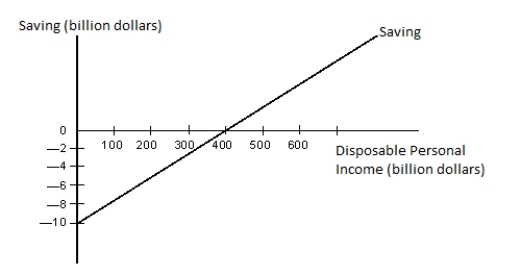
The figure given below represents the saving function of an economy.
Figure 9.1
 -Refer to Figure 9.1. At the real GDP level of $400 billion, which of the following statements is true?
A) There is dissaving.
B) Saving is equal to $10 billion.
C) Consumption is equal to disposable income.
D) The slope of the saving function is equal to zero.
E) The slope of the consumption function is equal to zero.
Correct Answer

verified
Correct Answer
verified
Multiple Choice
The sum of the MPC and the MPS is always:
A) greater than 1.
B) less than 1.
C) equal to 1.
D) equal to zero.
E) between 0 and 1.
Correct Answer

verified
Correct Answer
verified
Multiple Choice
The consumption function becomes flatter if:
A) the average propensity to spend increases.
B) the marginal propensity to spend increases.
C) the marginal propensity to save increases.
D) the autonomous consumption increases.
E) the autonomous consumption decreases.
Correct Answer

verified
Correct Answer
verified
True/False
Other things equal, a marginal propensity to import of 0.8 implies that a $100 million increase in domestic income will lead to an $80 million decrease in net exports.
Correct Answer

verified
Correct Answer
verified
Multiple Choice
The figure given below represents the saving function of an economy.
Figure 9.1
 -Refer to Figure 9.1. Which of the following statements is true for real GDP levels below $400 billion?
A) Saving exists because consumption is smaller than disposable income.
B) Saving does not exist because consumption exceeds disposable income.
C) The corresponding section of the consumption function lies below the 45-degree line.
D) Autonomous consumption is equal to zero.
E) The slope of the consumption function becomes negative.
Correct Answer

verified
B
Correct Answer
verified
Multiple Choice
In the table given below Y represent the aggregate expenditure of the economy on C = consumption, I = investment, G = government projects, and X = net exports. Table 9.3 -Refer to Table 9.3. The intercept of the C+ I+ G+ X function is at an aggregate expenditures level of:
A) $125.
B) $150.
C) $275.
D) $315.
E) $335.
Correct Answer

verified
Correct Answer
verified
True/False
Other things equal, a decrease in the cost of capital would be associated with an upward shift of the investment function and, hence, with a rise in aggregate expenditures.
Correct Answer

verified
Correct Answer
verified
Multiple Choice
If a household's disposable income increases from $50,000 to $100,000 and its consumption increases from $40,000 to $80,000, the MPS must be _____.
A) 0.4
B) 0.8
C) 0.7
D) 0.2
E) 0.5
Correct Answer

verified
D
Correct Answer
verified
Showing 1 - 20 of 120
Related Exams