A) 2.5...6.5
B) 6.5...2.5
C) 1.5...8.5
D) 8.5...1.5
E) 3.5...4.5
Correct Answer

verified
Correct Answer
verified
Multiple Choice
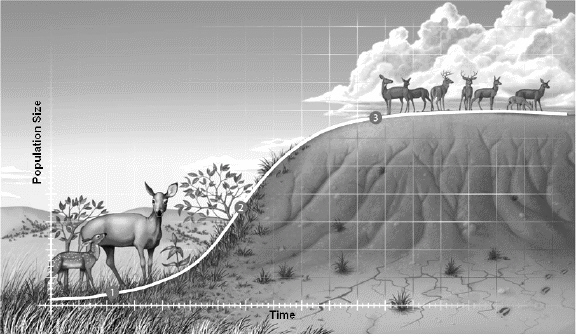
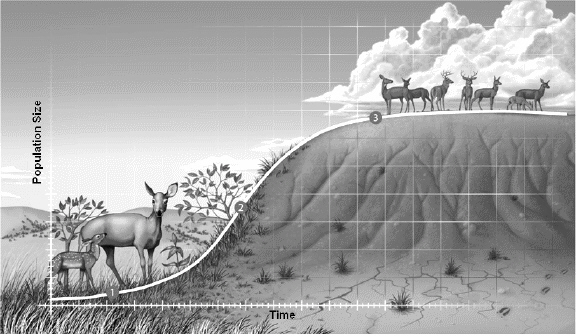
 Examine the figure above and answer the following question(s) . During the third phase "3", the population growth slows and then levels off because
A) essential resources become scarce.
B) the carrying capacity has been reached.
C) competition for food becomes increasingly important.
D) predators eat fawns as they are born.
E) all of these occur except "predators eat fawns as they are born."
Correct Answer

verified
Correct Answer
verified
Multiple Choice
Which of the following is a density-dependent factor that would control the size of a population?
A) wind velocity
B) light intensity
C) resource availability
D) rainfall
E) wave action in an intertidal zone
Correct Answer

verified
Correct Answer
verified
Multiple Choice
Which of the following factors is NOT a density-independent factor?
A) earthquakes
B) snowstorms
C) competition
D) hurricanes
E) tsunamis
Correct Answer

verified
Correct Answer
verified
Multiple Choice
The exponential growth rate of a population under ideal conditions is its
A) carrying capacity.
B) logistic growth.
C) biotic potential.
D) realized niche.
E) density dependence.
Correct Answer

verified
Correct Answer
verified
Multiple Choice
Jellyfish are as likely to die at one age as any other. Thus, a type ___ survivorship curve characterizes their life history.
A) I
B) II
C) III
D) more than one of these
E) none of these
Correct Answer

verified
Correct Answer
verified
Multiple Choice
The number of individuals of the same species in some specified area or volume of habitat is the
A) population density.
B) population growth.
C) population birth rate.
D) population size.
E) carrying capacity.
Correct Answer

verified
Correct Answer
verified
Multiple Choice
Which of the following is NOT a factor that has led to a dramatic increase in the human population?
A) increase in the carrying capacity
B) increased reproductive life expectancy
C) human invasion of new habitats and climatic zones
D) a reversal from K-selected reproduction to r-selected reproduction
E) the development of public health and the germ theory of diseases
Correct Answer

verified
Correct Answer
verified
Multiple Choice
A change in a population that is NOT related strictly to the size of the population is best described as
A) density-dependent.
B) density-independent.
C) biotic.
D) logistic.
E) exponential.
Correct Answer

verified
Correct Answer
verified
Multiple Choice
Guppies preyed upon by Killifish are __ species.
A) type I
B) K-selected
C) type II
D) r-selected
E) more than one of these types of
Correct Answer

verified
Correct Answer
verified
Multiple Choice
Which of the following situations would NOT result in a clumped population distribution?
A) zebras form herds to protect themselves from predators
B) oak seeds do not fall far from their parent tree
C) rotifer populations growing in a pond reproduce asexually
D) in a dense population, penguins maintain a certain space between neighborhoods to avoid aggression and protect their territory
E) all of these situations would result in a clumped population distribution
Correct Answer

verified
Correct Answer
verified
Multiple Choice
A group of organisms of the same species that live in a specific location is called a(n)
A) community.
B) population.
C) species.
D) genus.
E) biome.
Correct Answer

verified
Correct Answer
verified
Multiple Choice
For a given population, life history pattern focuses on aspects such as
A) number of breeding events.
B) availability of resources.
C) climatic conditions.
D) quality of habitat.
E) all of these.
Correct Answer

verified
Correct Answer
verified
Multiple Choice
Horses typically can live around 30 years and a healthy mare can produce one foal per year. Horses are __ species.
A) opportunistic
B) type I
C) K-selected
D) r-selected
E) more than one of these types of
Correct Answer

verified
Correct Answer
verified
Multiple Choice
Which of the following countries has the smallest ecological footprint?
A) Mexico
B) China
C) United States
D) India
E) Canada
Correct Answer

verified
Correct Answer
verified
Multiple Choice
In Michigan, the population of Canadian geese changed from 9,000 to a population of ___ in 2008.
A) 3,000
B) 30,000
C) 300,000
D) 3,000,000
E) 30,000,000
Correct Answer

verified
Correct Answer
verified
Multiple Choice
The most sustainable method for limiting human population growth is
A) decreasing birth rate.
B) increasing carrying capacity.
C) decreasing competition.
D) increasing death rate.
E) exploiting outer space.
Correct Answer

verified
Correct Answer
verified
Multiple Choice
 Examine the figure above and answer the following question(s) . This figure describes a typical example of
A) biotic potential growth.
B) exponential growth.
C) logistic growth.
D) logarithmic growth.
E) density-dependent growth.
Correct Answer

verified
Correct Answer
verified
Multiple Choice
A population ecologist is study the demographics of American bison living on a grassland in North Dakota. She captures, marks, and releases 100 bison. Later, she recaptures 100 bison and discovers that 50 were previously marked and half of those marked are of reproductive age. What is the population ecologist's estimate of how many bison in the total population are of reproductive age?
A) 200
B) 50
C) 100
D) 20
E) 10
Correct Answer

verified
Correct Answer
verified
Multiple Choice
In a population growing exponentially,
A) the number of individuals added to the population next year is greater than the number added this year.
B) the population growth rate increases year after year.
C) net reproduction per individual increases year after year.
D) the number of individuals added to the population next year is greater than the number added this year, and the population growth rate increases year after year.
E) the number of individuals added to the population next year is greater than the number added this year, the population growth rate increases year after year, and net reproduction per individual increases year after year.
Correct Answer

verified
Correct Answer
verified
Showing 21 - 40 of 96
Related Exams