A) price levels.
B) levels of GDP.
C) rates of interest.
D) levels of taxation.
Correct Answer

verified
Correct Answer
verified
Multiple Choice
Exhibit 8-5 Consumption function 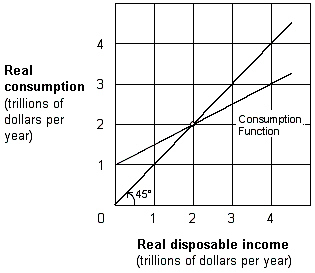 As shown in Exhibit 8-5, the marginal propensity to consume (MPC) is:
A) 0.25.
B) 0.50.
C) 0.75.
D) 0.90.
Correct Answer

verified
Correct Answer
verified
Multiple Choice
Exhibit 8-10 Consumption function 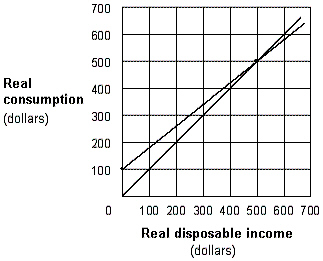 In Exhibit 8-10, the value of the marginal propensity to consume is:
A) .75.
B) .80.
C) .50.
D) .25.
E) .20.
Correct Answer

verified
Correct Answer
verified
Multiple Choice
Exhibit 8-9 Aggregate expenditures function 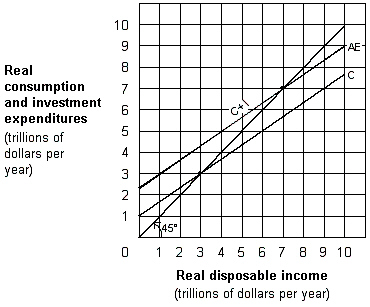 In Exhibit 8-9, what is the households' marginal propensity to consume (MPC) ?
A) 0.5.
B) 0.67.
C) 0.75.
D) 0.80.
Correct Answer

verified
Correct Answer
verified
True/False
The marginal propensity to save plus the marginal propensity to consume always equals 1.
Correct Answer

verified
Correct Answer
verified
Multiple Choice
According to Keynes, what is the most important determinant of households' spending on goods and services?
A) The price level.
B) The interest rate.
C) Autonomous consumption.
D) Disposable income.
Correct Answer

verified
Correct Answer
verified
Multiple Choice
Exhibit 8-4 Disposable income and consumption data  Note: All amounts are in billions of dollars per year. As shown in Exhibit 8-4, if disposable income is $100 billion, the marginal propensity to consume (MPC) is:
A) 0.00.
B) 0.25.
C) 0.75.
D) 1.00.
Correct Answer

verified
Correct Answer
verified
Multiple Choice
Exhibit 8-10 Consumption function 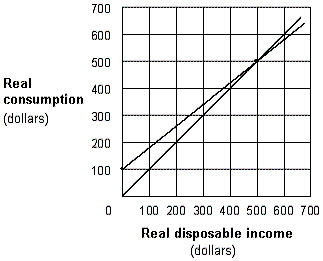 In Exhibit 8-10, when disposable income is equal to zero, saving is equal to:
A) $0.
B) $100.
C) - $50.
D) - $100.
E) $50.
Correct Answer

verified
Correct Answer
verified
Multiple Choice
The nation has its own MPC. When disposable income increases from $300 billion to $400 billion, national consumption increases from $300 billion to $360 billion. At Y = $400 billion, the MPC is:
A) 0.2.
B) 0.5.
C) 0.6.
D) 0.67.
E) 1.33.
Correct Answer

verified
Correct Answer
verified
Multiple Choice
In the Keynesian aggregate expenditure model, the 45-degree line indicates:
A) amounts households plan to spend at each possible level of income.
B) amounts households plan to save at each possible level of income.
C) all income levels at which the planned spending of decision makers equals total output.
D) all income levels at which the marginal propensity to consume is one.
Correct Answer

verified
Correct Answer
verified
Multiple Choice
Exhibit 8-4 Disposable income and consumption data
 Note: All amounts are in billions of dollars per year. As shown in Exhibit 8-4, if disposable income is $400 billion, the marginal propensity to consume (MPC) is:
A) 0.00.
B) 0.25.
C) 0.75.
D) 1.00.
Correct Answer

verified
Correct Answer
verified
Multiple Choice
As shown in Exhibit 8-2, dissaving occurs:
A) at $5 trillion.
B) between 0 and $4 trillion.
C) where disposable income is greater than $4 trillion.
D) at $8 trillion.
Correct Answer

verified
Correct Answer
verified
Multiple Choice
As shown in Exhibit 8-3, saving occurs:
A) at 0.
B) between 0 and $5 trillion.
C) where real disposable income is greater than $5 trillion.
D) at $5 trillion.
Correct Answer

verified
Correct Answer
verified
Multiple Choice
The vertical intercept of the consumption function that represents the portion of consumption expenditure not associated with a level of disposable income is known as:
A) zero income intercept.
B) disposable income intercept.
C) autonomous consumption.
D) automatic consumption line.
Correct Answer

verified
Correct Answer
verified
Multiple Choice
If, for a given disposable income level, the disposable income line lies below the consumption curve, saving:
A) equals consumption.
B) equals disposable income.
C) is less than zero.
D) is equal to zero.
E) is greater than zero.
Correct Answer

verified
Correct Answer
verified
Multiple Choice
Exhibit 8-13 Investment expenditures 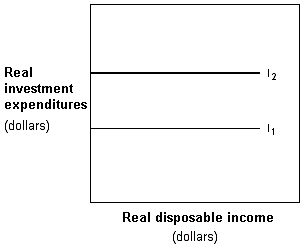 In Exhibit 8-13, which of the following could cause the shift from I1 to I2?
A) Lower money holdings.
B) Lower interest rates.
C) Expectations of a future economic slow-down.
D) Lower disposable income.
E) Lower capacity utilization.
Correct Answer

verified
Correct Answer
verified
True/False
If people become pessimistic about the state of the economy, the consumption function shifts upward.
Correct Answer

verified
Correct Answer
verified
Multiple Choice
If the economy were left on its own without the interference of government or the Fed, it would move toward an equilibrium rate of growth that would produce, with only minor interruptions, full employment without inflation. What school supports this view?
A) Classical.
B) Keynesian.
C) Monetarism.
D) Supply-side.
E) Neo-Keynesian.
Correct Answer

verified
Correct Answer
verified
Multiple Choice
If your disposable income increases from $30,000 to $35,000 and your consumption increases from $11,000 to $12,000, your marginal propensity to consume (MPC) is:
A) 0.2.
B) 0.4.
C) 0.5.
D) 0.8.
E) 1.0.
Correct Answer

verified
Correct Answer
verified
Multiple Choice
Exhibit 8-2 Consumption function 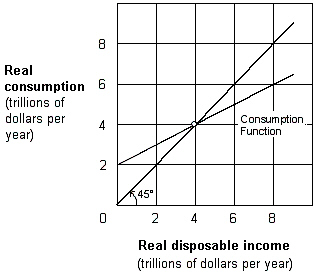 As shown in Exhibit 8-2, the marginal propensity to save (MPS) is:
A) 0.25.
B) 0.50.
C) 0.75.
D) 0.90.
Correct Answer

verified
Correct Answer
verified
Showing 81 - 100 of 235
Related Exams