A) mean time.
B) median time.
C) most likely timE.
D) mode time.
E) marginal time.
Correct Answer

verified
Correct Answer
verified
Multiple Choice
Consider the following work breakdown structure:  What is the estimated standard deviation in the time for activity D?
A) 0 days
B) 2 days
C) 3 days
D) 4 days
E) 12 days
Correct Answer

verified
Correct Answer
verified
Multiple Choice
Consider the portion of a project depicted by this graph:  What is the latest start time of activity 6-7 if the latest finish of activity 7-8 is 26, and the latest finish of activity 7-9 is 23?
A) 18
B) 17
C) 13
D) 12
E) 10
Correct Answer

verified
Correct Answer
verified
Multiple Choice
Consider the following work breakdown structure:  What is the estimated slack time for activity W?
A) 0 days
B) 25 days
C) 35 days
D) 45 days
E) 85 days
Correct Answer

verified
Correct Answer
verified
True/False
The main function of dummy activities is to clarify relationships in network diagrams.
Correct Answer

verified
Correct Answer
verified
Multiple Choice
Consider the following work breakdown structure:  What is the estimated slack time for activity D?
A) 0 days
B) 30 days
C) 40 days
D) 50 days
E) 100 days
Correct Answer

verified
Correct Answer
verified
True/False
Path probabilities are calculated by dividing path mean by path standard deviations.
Correct Answer

verified
Correct Answer
verified
Multiple Choice
Which of the following is not one of the six key decisions in project management? (I) Selecting the project team (II) Deciding on the project manager's title (III) Managing and controlling project resources (IV) Deciding which projects to implement (V) Selecting the project manager
A) I
B) II
C) III
D) IV
E) V
Correct Answer

verified
Correct Answer
verified
Multiple Choice
A project is represented by the following diagram:  The expected duration of this project is:
A) 13.
B) 15.
C) 20.
D) 52.
E) 81.
Correct Answer

verified
Correct Answer
verified
Multiple Choice
Consider the following work breakdown structure:  What is the estimated slack time for activity A?
A) 0 days
B) 20 days
C) 40 days
D) 60 days
E) 100 days
Correct Answer

verified
Correct Answer
verified
True/False
The network diagram shows sequential relationships among major activities on a project.
Correct Answer

verified
Correct Answer
verified
Multiple Choice
Consider the following work breakdown structure:  What is the estimated standard deviation in the time for activity E?
A) 1 days
B) 2 days
C) 3 days
D) 4 days
E) 5 days
Correct Answer

verified
Correct Answer
verified
True/False
The latest starting time for an activity is equal to the latest finish time minus the activity time.
Correct Answer

verified
Correct Answer
verified
Multiple Choice
The advantage a precedence diagram has over a Gantt chart is:
A) its ability to reveal relationships among activities.
B) its difficulty in depicting networks.
C) its complexity.
D) its simplicity.
E) its lack of riskiness.
Correct Answer

verified
Correct Answer
verified
True/False
A disadvantage of activity-on-node diagrams is the occasional need for dummy activities.
Correct Answer

verified
Correct Answer
verified
Multiple Choice
There are four activities on the critical path, and they have standard deviations of 1, 2, 4, and 2 days. The standard deviation of the critical path is:
A) 3.
B) 5.
C) 9.
D) 16.
E) 25.
Correct Answer

verified
Correct Answer
verified
Multiple Choice
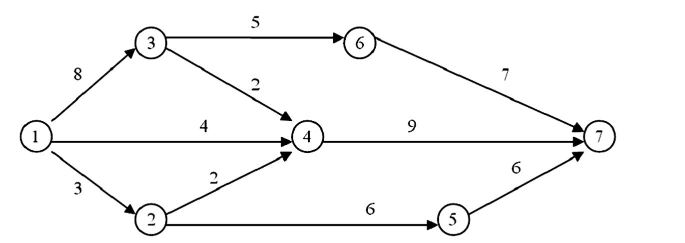
A project is represented by the following diagram:  The critical path for the network shown is:
A) 1-3-6-7.
B) 1-2-4-7.
C) 1-4-7.
D) 1-3-4-7.
E) 1-2-5-7.
Correct Answer

verified
Correct Answer
verified
Multiple Choice
A PERT/CPM activity has an optimistic time estimate of three days, a most likely time estimate of eight days, and a pessimistic time estimate of 10 days. The expected time (in days) of this activity is:
A) 7.0.
B) 7.5.
C) 8.0.
D) 8.5.
E) 10.0.
Correct Answer

verified
Correct Answer
verified
Multiple Choice
Concerning PERT and CPM:
A) These are two different names for essentially the same techniquE.
B) CPM tends to focus more on the critical path; PERT focuses on the parallel paths.
C) PERT gives a clearer indication of activity slack, while CPM gives a better picture of path slack.
D) Because of its recent discovery, much less is known about CPM than PERT.
E) CPM is useful for project manager selection; PERT is useful for project team selection.
Correct Answer

verified
Correct Answer
verified
Multiple Choice
At which point does crashing of a project cease?
A) when the project is completed
B) when no additional crashing is possible
C) when the cost to crash equals or exceeds the benefit of crashing
D) when the project is one-half completed
E) when the team has been disbanded
Correct Answer

verified
Correct Answer
verified
Showing 41 - 60 of 113
Related Exams