Correct Answer

verified
Correct Answer
verified
Multiple Choice
Figure 8-9
The vertical distance between points A and C represent a tax in the market. 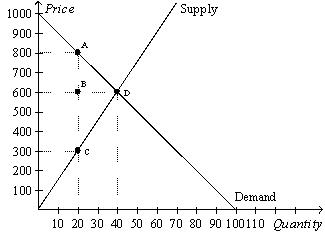 -Refer to Figure 8-9. The imposition of the tax causes the price paid by buyers to
A) increase from $600 to $800.
B) increase from $300 to $800.
C) decrease from $600 to $300.
D) remain unchanged at $600.
Correct Answer

verified
Correct Answer
verified
Multiple Choice
Figure 8-6
The vertical distance between points A and B represents a tax in the market. 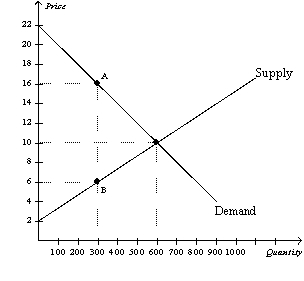 -Refer to Figure 8-6. What happens to total surplus in this market when the tax is imposed?
A) Total surplus increases by $1,500.
B) Total surplus increases by $3,000.
C) Total surplus decreases by $1,500.
D) Total surplus decreases by $,3000.
Correct Answer

verified
Correct Answer
verified
Multiple Choice
Suppose a tax of $0.50 per unit on a good creates a deadweight loss of $100. If the tax is increased to $2.50 per unit, the deadweight loss from the new tax would be
A) $200.
B) $250.
C) $500.
D) $2,500.
Correct Answer

verified
Correct Answer
verified
True/False
A tax on a good causes the size of the market to shrink.
Correct Answer

verified
Correct Answer
verified
Multiple Choice
Figure 8-9
The vertical distance between points A and C represent a tax in the market.  -Refer to Figure 8-9. The total surplus with the tax is
A) $2,000.
B) $3,000.
C) $15,000.
D) $20,000.
Correct Answer

verified
Correct Answer
verified
True/False
Tax revenues increase in direct proportion to increases in the size of the tax.
Correct Answer

verified
Correct Answer
verified
Multiple Choice
Figure 8-9
The vertical distance between points A and C represent a tax in the market.  -Refer to Figure 8-9. The per-unit burden of the tax on buyers is
A) $20.
B) $200.
C) $300.
D) $500.
Correct Answer

verified
Correct Answer
verified
Multiple Choice
Figure 8-3
The vertical distance between points A and C represents a tax in the market. 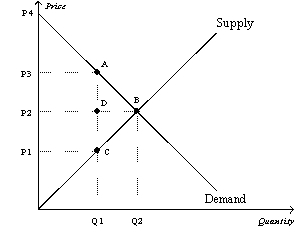 -Refer to Figure 8-3. The per-unit burden of the tax on sellers is
A) P3 - P1.
B) P3 - P2.
C) P2 - P1.
D) P4 - P3.
Correct Answer

verified
Correct Answer
verified
Multiple Choice
Figure 8-7
The vertical distance between points A and B represents a tax in the market. 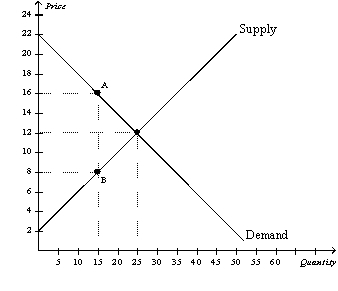 -Refer to Figure 8-7. As a result of the tax,
A) consumer surplus decreases from $150 to $60.
B) producer surplus decreases from $125 to $45.
C) the market experiences a deadweight loss of $45.
D) All of the above are correct.
Correct Answer

verified
Correct Answer
verified
Multiple Choice
For a good that is taxed, the area on the relevant supply-and-demand graph that represents government's tax revenue is
A) smaller than the area that represents the loss of consumer surplus and producer surplus caused by the tax.
B) bounded by the supply curve, the demand curve, the effective price paid by buyers, and the effective price received by sellers.
C) a right triangle.
D) a triangle, but not necessarily a right triangle.
Correct Answer

verified
Correct Answer
verified
True/False
Total surplus in a market does not change when the government imposes a tax on that market because the loss of consumer surplus and producer surplus is equal to the gain of government revenue.
Correct Answer

verified
Correct Answer
verified
True/False
When a tax is imposed on buyers, consumer surplus decreases but producer surplus increases.
Correct Answer

verified
Correct Answer
verified
Multiple Choice
Figure 8-2
The vertical distance between points A and B represents a tax in the market. 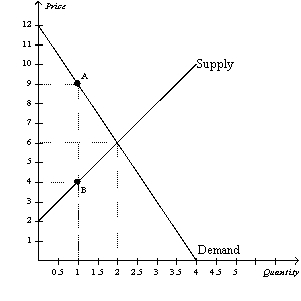 -Refer to Figure 8-2. The loss of consumer surplus for those buyers of the good who continue to buy it after the tax is imposed is
A) $0.
B) $1.50.
C) $3.
D) $4.50.
Correct Answer

verified
Correct Answer
verified
Multiple Choice
When the price of a good is measured in dollars, then the size of the deadweight loss that results from taxing that good is measured in
A) units of the good that is being taxed.
B) units of a related good that is not being taxed.
C) dollars.
D) percentage change.
Correct Answer

verified
Correct Answer
verified
Multiple Choice
The amount of deadweight loss from a tax depends upon the
A) price elasticity of demand.
B) price elasticity of supply.
C) amount of the tax per unit.
D) All of the above are correct.
Correct Answer

verified
Correct Answer
verified
Multiple Choice
Figure 8-3
The vertical distance between points A and C represents a tax in the market.  -Refer to Figure 8-3. The per unit burden of the tax on buyers is
A) P3 - P1.
B) P3 - P2.
C) P2 - P1.
D) P4 - P3.
Correct Answer

verified
Correct Answer
verified
Multiple Choice
An increase in the size of a tax is most likely to increase tax revenue in a market with
A) elastic demand and elastic supply.
B) elastic demand and inelastic supply.
C) inelastic demand and elastic supply.
D) inelastic demand and inelastic supply.
Correct Answer

verified
Correct Answer
verified
Multiple Choice
One result of a tax, regardless of whether the tax is placed on the buyers or the sellers, is that the
A) size of the market is unchanged.
B) price the seller effectively receives is higher.
C) supply curve for the good shifts upward by the amount of the tax.
D) tax reduces the welfare of both buyers and sellers.
Correct Answer

verified
Correct Answer
verified
Multiple Choice
Figure 8-9
The vertical distance between points A and C represent a tax in the market.  -Refer to Figure 8-9. The producer surplus without the tax is
A) $3,000.
B) $8,000.
C) $12,000.
D) $24,000.
Correct Answer

verified
Correct Answer
verified
Showing 181 - 200 of 422
Related Exams