Correct Answer

verified
Correct Answer
verified
Multiple Choice
When tires are taxed and sellers of tires are required to pay the tax to the government,
A) the quantity of tires bought and sold in the market is reduced.
B) the price paid by buyers of tires decreases.
C) the demand for tires decreases.
D) there is a movement downward and to the right along the demand curve for tires.
Correct Answer

verified
Correct Answer
verified
Multiple Choice
Figure 8-9
The vertical distance between points A and C represent a tax in the market. 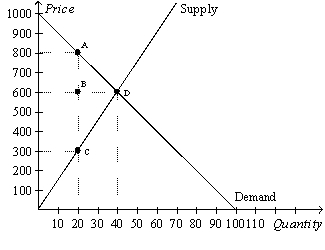 -Refer to Figure 8-9.The amount of tax revenue received by the government is
A) $4,000.
B) $6,000.
C) $10,000.
D) $24,000.
Correct Answer

verified
Correct Answer
verified
Multiple Choice
Scenario 8-2 Tom mows Stephanie's lawn for $25.Tom's opportunity cost of mowing Stephanie's lawn is $20,and Stephanie's willingness to pay Tom to mow her lawn is $28. -Refer to Scenario 8-2.If Stephanie hires Tom to mow her lawn,Stephanie's consumer surplus is
A) $3.
B) $5.
C) $8.
D) $25.
Correct Answer

verified
Correct Answer
verified
Multiple Choice
Figure 8-9
The vertical distance between points A and C represent a tax in the market.  -Refer to Figure 8-9.The producer surplus with the tax is
A) $3,000.
B) $6,000.
C) $9,000.
D) $12,000.
Correct Answer

verified
Correct Answer
verified
Multiple Choice
Figure 8-9
The vertical distance between points A and C represent a tax in the market.  -Refer to Figure 8-9.The per-unit burden of the tax on buyers is
A) $20.
B) $200.
C) $300.
D) $500.
Correct Answer

verified
Correct Answer
verified
Multiple Choice
In which of the following cases is it most likely that an increase in the size of a tax will decrease tax revenue?
A) The price elasticity of demand is small,and the price elasticity of supply is large.
B) The price elasticity of demand is large,and the price elasticity of supply is small.
C) The price elasticity of demand and the price elasticity of supply are both small.
D) The price elasticity of demand and the price elasticity of supply are both large.
Correct Answer

verified
Correct Answer
verified
Multiple Choice
Deadweight loss measures the loss
A) in a market to buyers and sellers that is not offset by an increase in government revenue.
B) in revenue to the government when buyers choose to buy less of the product because of the tax.
C) of equality in a market due to government intervention.
D) of total revenue to business firms due to the price wedge caused by the tax.
Correct Answer

verified
Correct Answer
verified
Multiple Choice
Figure 8-5
Suppose that the government imposes a tax of P3 - P1. 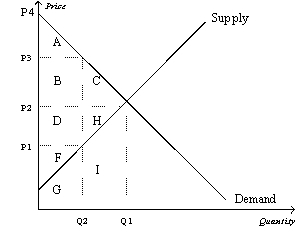 -Refer to Figure 8-5.The tax causes a reduction in consumer surplus that is represented by area
A) A.
B) B+C.
C) C+H.
D) F.
Correct Answer

verified
Correct Answer
verified
Essay
Illustrate on three demand-and-supply graphs how the size of a tax (small,medium and large)can alter total revenue and deadweight loss.
Correct Answer

verified
11ea6f3b_0de9_a204_af34_89b7957013d8_TB4798_00 11ea6f3b_0de9_a205_af34_e5a1a07a08b3_TB4798_00
Correct Answer
verified
Multiple Choice
Figure 8-20.The figure represents the relationship between the size of a tax and the tax revenue raised by that tax. 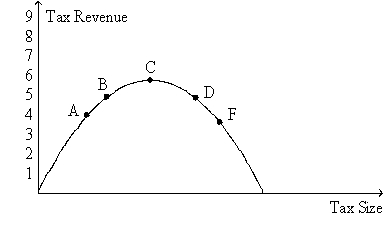 -Refer to Figure 8-20.For an economy that is currently at point D on the curve,a decrease in the tax rate would
A) decrease consumer surplus.
B) decrease producer surplus.
C) increase tax revenue.
D) increase the deadweight loss of the tax.
Correct Answer

verified
Correct Answer
verified
Multiple Choice
Figure 8-8
Suppose the government imposes a $10 per unit tax on a good. 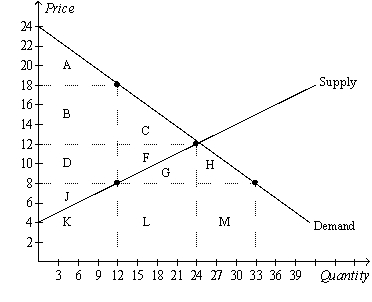 -Refer to Figure 8-8.The decrease in consumer and producer surpluses that is not offset by tax revenue is the area
A) C.
B) F.
C) G.
D) C+F.
Correct Answer

verified
Correct Answer
verified
Multiple Choice
A tax placed on buyers of airline tickets shifts the
A) demand curve for airline tickets downward,decreasing the price received by sellers of airline tickets and causing the quantity of airline tickets to increase.
B) demand curve for airline tickets downward,decreasing the price received by sellers of airline tickets and causing the quantity of airline tickets to decrease.
C) supply curve for airline tickets upward,decreasing the effective price paid by buyers of airline tickets and causing the quantity of airline tickets to increase.
D) supply curve for airline tickets upward,increasing the effective price paid by buyers of airline tickets and causing the quantity of airline tickets to decrease.
Correct Answer

verified
B
Correct Answer
verified
Multiple Choice
Figure 8-6
The vertical distance between points A and B represents a tax in the market. 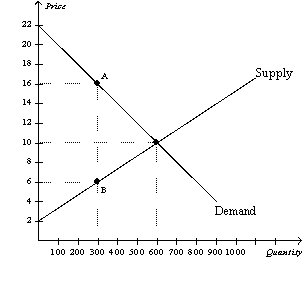 -Refer to Figure 8-6.Total surplus with the tax in place is
A) $1,500.
B) $3,600.
C) $4,500.
D) $6,000.
Correct Answer

verified
C
Correct Answer
verified
Multiple Choice
Who once said that taxes are the price we pay for a civilized society?
A) Milton Friedman
B) Theodore Roosevelt
C) Arthur Laffer
D) Oliver Wendell Holmes,Jr.
Correct Answer

verified
Correct Answer
verified
Multiple Choice
Figure 8-19.The figure represents the relationship between the size of a tax and the tax revenue raised by that tax. 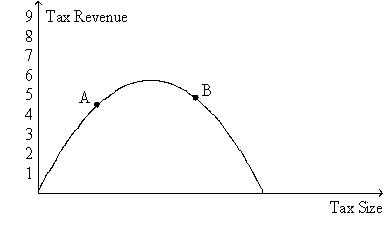 -Refer to Figure 8-19.If the economy is at point B on the curve,then an increase in the tax rate will
A) increase the deadweight loss of the tax and increase tax revenue.
B) increase the deadweight loss of the tax and decrease tax revenue.
C) decrease the deadweight loss of the tax and increase tax revenue.
D) decrease the deadweight loss of the tax and decrease tax revenue.
Correct Answer

verified
Correct Answer
verified
Multiple Choice
Figure 8-13 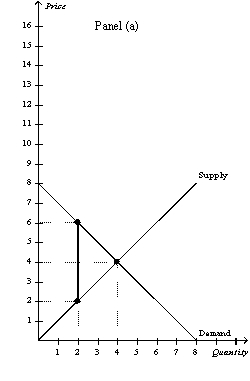
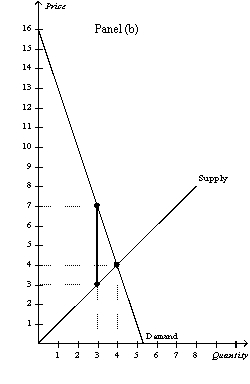 -Refer to Figure 8-13.Panel (a) and Panel (b) each illustrate a $4 tax placed on a market.In comparison to Panel (b) ,Panel (a) illustrates which of the following statements?
A) When demand is relatively inelastic,the deadweight loss of a tax is smaller than when demand is relatively elastic.
B) When demand is relatively elastic,the deadweight loss of a tax is larger than when demand is relatively inelastic.
C) When supply is relatively inelastic,the deadweight loss of a tax is smaller than when supply is relatively elastic.
D) When supply is relatively elastic,the deadweight loss of a tax is larger than when supply is relatively inelastic.
Correct Answer

verified
Correct Answer
verified
Multiple Choice
Figure 8-10 ![Figure 8-10 -Refer to Figure 8-10.Suppose the government imposes a tax that reduces the quantity sold in the market after the tax to Q2.With the tax,the total surplus is A) [x (P0-P5) x Q5] + [x (P5-0) x Q5]. B) [x (P0-P2) x Q2] +[(P2-P8) x Q2] + [x (P8-0) x Q2]. C) (P2-P8) x Q2. D) x (P2-P8) x (Q5-Q2) .](https://d2lvgg3v3hfg70.cloudfront.net/TB4798/11ea6f3b_0de3_ae7f_af34_49bb46854036_TB4798_00_TB4798_00_TB4798_00_TB4798_00_TB4798_00_TB4798_00_TB4798_00_TB4798_00_TB4798_00_TB4798_00_TB4798_00.jpg) -Refer to Figure 8-10.Suppose the government imposes a tax that reduces the quantity sold in the market after the tax to Q2.With the tax,the total surplus is
-Refer to Figure 8-10.Suppose the government imposes a tax that reduces the quantity sold in the market after the tax to Q2.With the tax,the total surplus is
A) [x (P0-P5) x Q5] + [x (P5-0) x Q5].
B) [x (P0-P2) x Q2] +[(P2-P8) x Q2] + [x (P8-0) x Q2].
C) (P2-P8) x Q2.
D) x (P2-P8) x (Q5-Q2) .
Correct Answer

verified
Correct Answer
verified
Multiple Choice
Figure 8-6
The vertical distance between points A and B represents a tax in the market.  -Refer to Figure 8-6.Without a tax,consumer surplus in this market is
A) $1,500.
B) $2,400.
C) $3,000.
D) $3,600.
Correct Answer

verified
Correct Answer
verified
Multiple Choice
Scenario 8-1 Erin would be willing to pay as much as $100 per week to have her house cleaned.Ernesto's opportunity cost of cleaning Erin's house is $70 per week. -Refer to Scenario 8-1.If Ernesto cleans Erin's house for $80,Ernesto's producer surplus is
A) $80.
B) $30.
C) $20.
D) $10.
Correct Answer

verified
Correct Answer
verified
Showing 1 - 20 of 421
Related Exams