A) P3ACP1.
B) ABC.
C) P2ADP3.
D) P1DCP2.
Correct Answer

verified
Correct Answer
verified
Multiple Choice
According to Arthur Laffer,the graph that represents the amount of tax revenue (measured on the vertical axis) as a function of the size of the tax (measured on the horizontal axis) looks like
A) a U.
B) an upside-down U.
C) a horizontal straight line.
D) an upward-sloping line or curve.
Correct Answer

verified
Correct Answer
verified
True/False
Tax revenue equals the size of the tax multiplied by the quantity sold in the market after the tax is levied.
Correct Answer

verified
Correct Answer
verified
Multiple Choice
Figure 8-1 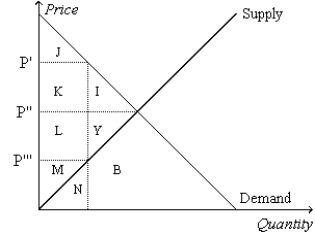 -Refer to Figure 8-1.Suppose the government imposes a tax of P' - P'''.The area measured by J represents
A) consumer surplus after the tax.
B) consumer surplus before the tax.
C) producer surplus after the tax.
D) producer surplus before the tax.
Correct Answer

verified
Correct Answer
verified
Multiple Choice
What happens to the total surplus in a market when the government imposes a tax?
A) Total surplus increases by the amount of the tax.
B) Total surplus increases but by less than the amount of the tax.
C) Total surplus decreases.
D) Total surplus is unaffected by the tax.
Correct Answer

verified
Correct Answer
verified
Multiple Choice
Figure 8-3
The vertical distance between points A and C represents a tax in the market. 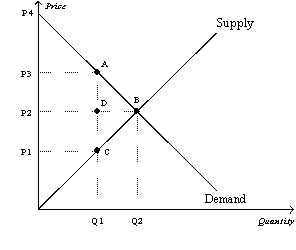 -Refer to Figure 8-3.Which of the following equations is valid for the tax revenue that the tax provides to the government?
A) Tax revenue = (P2 - P1) xQ1
B) Tax revenue = (P3 - P1) xQ1
C) Tax revenue = (P3 - P2) xQ1
D) Tax revenue = (P3 - P1) x(Q2 - Q1)
Correct Answer

verified
Correct Answer
verified
Multiple Choice
Assume that for good X the supply curve for a good is a typical,upward-sloping straight line,and the demand curve is a typical downward-sloping straight line.If the good is taxed,and the tax is tripled,the
A) base of the triangle that represents the deadweight loss triples.
B) height of the triangle that represents the deadweight loss triples.
C) deadweight loss of the tax increases by a factor of nine.
D) All of the above are correct.
Correct Answer

verified
Correct Answer
verified
Multiple Choice
Figure 8-10 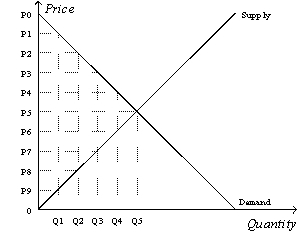 -Refer to Figure 8-10.Suppose the government imposes a tax that reduces the quantity sold in the market after the tax to Q2.The price that buyers pay is
A) P0.
B) P2.
C) P5.
D) P8.
Correct Answer

verified
Correct Answer
verified
Multiple Choice
Figure 8-8
Suppose the government imposes a $10 per unit tax on a good. 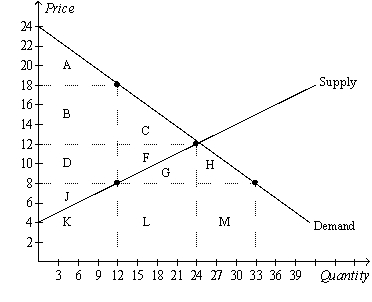 -Refer to Figure 8-8.One effect of the tax is to
A) reduce consumer surplus by $108.
B) reduce producer surplus by $72.
C) create a deadweight loss of $60.
D) All of the above are correct.
Correct Answer

verified
Correct Answer
verified
Multiple Choice
Taxes are of interest to
A) microeconomists because they consider how to balance equality and efficiency.
B) microeconomists because they consider how best to design a tax system.
C) macroeconomists because they consider how policymakers can use the tax system to stabilize economic activity.
D) All of the above are correct.
Correct Answer

verified
Correct Answer
verified
Multiple Choice
In a recent research paper published by the European Central Bank,two economists concluded that
A) tax revenue would increase in Denmark and Sweden if tax rates on capital income were reduced in those countries.
B) tax revenue would increase in Denmark and Sweden if tax rates on labor income were reduced in those countries.
C) tax revenue would increase in the U.S.if tax rates on capital income were reduced in the U.S.
D) tax revenue would increase in the U.S.if tax rates on labor income were reduced in the U.S.
Correct Answer

verified
Correct Answer
verified
Multiple Choice
The size of a tax and the deadweight loss that results from the tax are
A) positively related.
B) negatively related.
C) independent of each other.
D) equal to each other.
Correct Answer

verified
Correct Answer
verified
Multiple Choice
When a tax is levied on buyers,the
A) supply curves shifts upward by the amount of the tax.
B) tax creates a wedge between the price buyers effectively pay and the price sellers receive.
C) tax has no effect on the well-being of sellers.
D) All of the above are correct.
Correct Answer

verified
Correct Answer
verified
Multiple Choice
Figure 8-19.The figure represents the relationship between the size of a tax and the tax revenue raised by that tax. 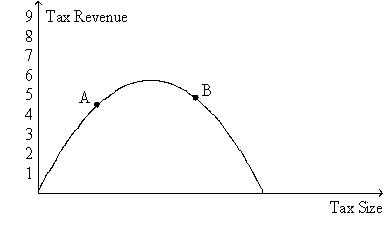 -Refer to Figure 8-19.If the economy is at point B on the curve,then a small decrease in the tax rate will
A) increase the deadweight loss of the tax and increase tax revenue.
B) increase the deadweight loss of the tax and decrease tax revenue.
C) decrease the deadweight loss of the tax and increase tax revenue.
D) decrease the deadweight loss of the tax and decrease tax revenue.
Correct Answer

verified
Correct Answer
verified
Multiple Choice
Figure 8-9
The vertical distance between points A and C represent a tax in the market. 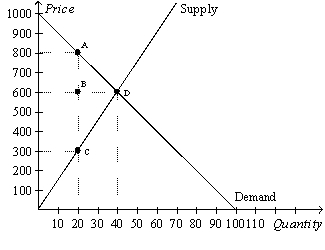 -Refer to Figure 8-9.The imposition of the tax causes the price received by sellers to decrease by
A) $20.
B) $200.
C) $300.
D) $500.
Correct Answer

verified
Correct Answer
verified
Multiple Choice
Andre walks Julia's dog once a day for $50 per week.Julia values this service at $60 per week,while the opportunity cost of Andre's time is $30 per week.The government places a tax of $35 per week on dog walkers.After the tax,what is the loss in total surplus?
A) $50
B) $30
C) $25
D) $0
Correct Answer

verified
Correct Answer
verified
True/False
A tax on a good causes the size of the market to increase.
Correct Answer

verified
Correct Answer
verified
Multiple Choice
Figure 8-6
The vertical distance between points A and B represents a tax in the market. 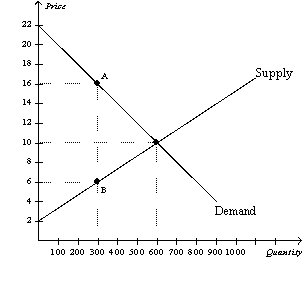 -Refer to Figure 8-6.When the tax is imposed in this market,consumer surplus is
A) $600.
B) $900.
C) $1,500.
D) $3,000.
Correct Answer

verified
Correct Answer
verified
Multiple Choice
Table 8-1
 -Refer to Table 8-1.Suppose the government is considering levying a tax in one or more of the markets described in the table.Which of the markets will maximize the deadweight loss(es) from the tax?
A) market B only
B) markets A and C only
C) markets B and D only
D) market D only
Correct Answer

verified
Correct Answer
verified
Multiple Choice
When a tax is imposed on a good,the
A) supply curve for the good always shifts.
B) demand curve for the good always shifts.
C) amount of the good that buyers are willing to buy at each price always remains unchanged.
D) equilibrium quantity of the good always decreases.
Correct Answer

verified
Correct Answer
verified
Showing 21 - 40 of 421
Related Exams