A) 1 only
B) 2 only
C) 3 only
D) 1 and 2
E) 2 and 3
Correct Answer

verified
Correct Answer
verified
Multiple Choice
Choose the statement that best compares the long-run equilibrium of a competitive industry with that in a monopolized industry (with a single price) .
A) Resources will be allocated efficiently in both the competitive and monopolized industries.
B) Allocative efficiency will be achieved in the competitive,but not the monopolized industry.
C) Allocative efficiency is not possible in either industry.
D) Allocative efficiency will be achieved in the monopolized,but not the competitive industry.
E) It is not possible to make this comparison because firms in a competitive industry operate only in the short run.
Correct Answer

verified
Correct Answer
verified
Multiple Choice
Consider a natural monopoly that is producing an output level such that it is experiencing decreasing returns to scale.If government policy requires the firm to set price equal to marginal cost,
A) the outcome will be allocatively efficient and the firm will be earning profits.
B) the outcome will be allocatively inefficient and the firm will be earning profits.
C) the outcome will be allocatively efficient and the firm will be incurring losses.
D) the outcome will be allocatively inefficient and the firm will be incurring losses.
E) the outcome will be allocatively efficient and the firm will be earning zero profits.
Correct Answer

verified
Correct Answer
verified
Multiple Choice
An economy in which there are no market failures and all industries are in a competitive long-run equilibrium is one where 1.allocative efficiency is achieved; 2.the economy is on the production possibilities boundary; 3.there is no incentive for firms to enter or leave industries.
A) 1 and 2
B) 2 and 3
C) 1 and 3
D) 1,2,and 3
E) 2 only
Correct Answer

verified
Correct Answer
verified
Multiple Choice
Consider three firms,A,B and C,all producing kilos of potatoes (per year) in a perfectly competitive market.The diagrams below show marginal cost curves for each of the three firms.  FIGURE 12-1
-Refer to Figure 12-1.Suppose each of Firms A,B and C are producing 500 kilos of potatoes.Keeping total output unchanged,what level of output should each firm be producing such that the industry is productively efficient?
A) Firm A: 200 kilos,Firm B: 500 kilos,Firm C: 800 kilos
B) Firm A: 700 kilos,Firm B: 800 kilos,Firm C: 0 kilos
C) Firm A: 500 kilos,Firm B: 800 kilos,Firm C: 200 kilos
D) Firm A: 500 kilos,Firm B: 500 kilos,Firm C: 500 kilos
E) Firm A: 500 kilos,Firm B: 200 kilos,Firm C: 200 kilos
Correct Answer

verified
Correct Answer
verified
Multiple Choice
The diagram below shows cost and revenue curves for a natural monopoly producing electricity.Price is dollars per kilowatt hour and quantity is kilowatt hours per day. 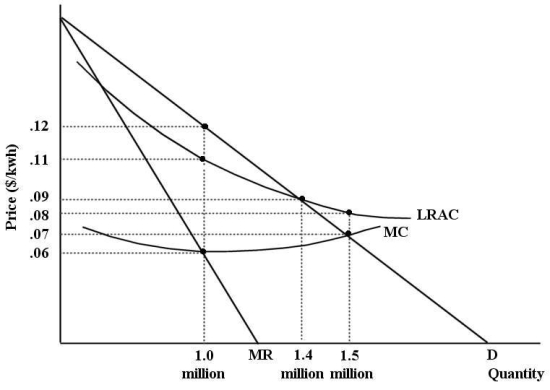 FIGURE 12-7
-Refer to Figure 12-7.Suppose this firm is being regulated using a policy of average-cost pricing.The resulting price and output would be ________ per kwh and ________ kwh per day.
A) $0.06; 1 million
B) $0.07; 1.5 million
C) $0.09; 1.4 million
D) $0.11; 1 million
E) $0.12; 1 million
Correct Answer

verified
Correct Answer
verified
Multiple Choice
The diagram below shows the market demand curve and the cost curves for a single firm. 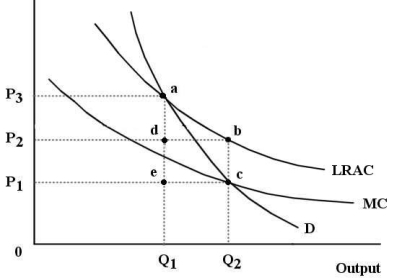 FIGURE 12-6
-Refer to Figure 12-6.Suppose this firm is a government-owned natural monopoly and imposes a price so as to achieve allocative efficiency in this market.The amount of tax revenue that the government must raise elsewhere in the economy to offset the losses of this firm is represented by the area
A) P1P3ae.
B) P1P2bc.
C) edbc.
D) Q1dbQ2.
E) 0P2bQ2.
Correct Answer

verified
Correct Answer
verified
Multiple Choice
The production possibilities boundary shows possible combinations of guns and butter that can be produced by a country.The lower diagram shows demand and supply for butter. 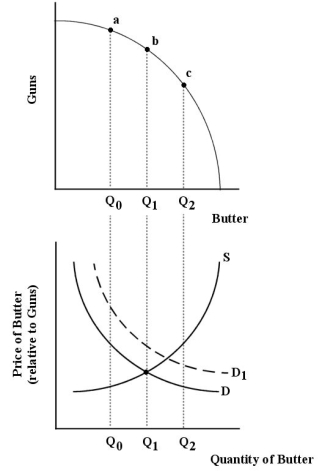 FIGURE 12-2
-Refer to Figure 12-2.Suppose this economy is allocatively efficient at Q1 units of butter.Now suppose there is an increase in demand for butter from D to D1.After this shift in demand,
A) the supply curve will shift up to S1 and allocative efficiency will be maintained.
B) the marginal value to consumers of butter is less than the marginal cost to producers; the price of butter (relative to the price of guns) rises; the economy moves to output Q2 of butter and point (c) on the PPB.
C) the marginal value to consumers of butter is greater than the marginal cost to producers; the price of butter (relative to the price of guns) rises; the economy moves to output Q2 of butter and point (c) on the PPB.
D) the increase in the price of butter (relative to the price of guns) will cause the demand curve to shift back down to D and allocative efficiency will be maintained.
E) the price of guns (relative to the price of butter) rises and the economy moves to point (a) on the PPB.
Correct Answer

verified
Correct Answer
verified
Multiple Choice
The diagram below shows supply,demand,and quantity exchanged of Monday matinee movie tickets.Assume it is a perfectly competitive market. 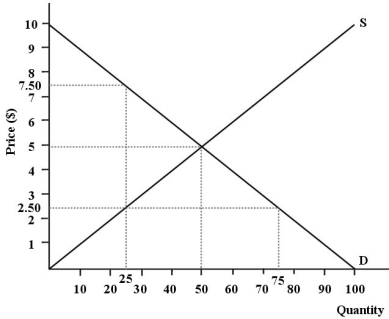 FIGURE 12-4
-Refer to Figure 12-4.Suppose a disequilibrium price of $7.50 per movie ticket is imposed on this market.The total economic surplus is now ________,which is ________ than the total economic surplus generated at the allocatively efficient level of output.
A) $125; $250 less
B) $125; $125 less
C) $187.50; $62.50 less
D) $62.50; $125 less
E) $187.50; $187.50 less
Correct Answer

verified
Correct Answer
verified
Multiple Choice
The objective of government regulation and competition policy can be described as a means to
A) promote economic efficiency.
B) make at least one person better off at the expense of others.
C) reduce inequality in the economy.
D) increase fairness in economic activities.
E) make all industries perfectly competitive.
Correct Answer

verified
Correct Answer
verified
Multiple Choice
Allocative efficiency is actively sought
A) by profit-maximizing firms in all market structures.
B) only by perfectly-competitive firms.
C) only by profit-maximizing imperfectly-competitive firms.
D) by none of the firms in any market.
E) by all firms in all markets.
Correct Answer

verified
Correct Answer
verified
Multiple Choice
If an economy is productively inefficient,it could improve its situation by
A) moving along its production possibilities boundary.
B) moving beyond its production possibilities boundary.
C) moving onto its production possibilities boundary.
D) acquiring more resources.
E) trading some of its resources.
Correct Answer

verified
Correct Answer
verified
Multiple Choice
Consider a regulated natural monopoly,such as an electricity distribution company,that faces falling long-run average costs.If it is forced to price its output at average cost it will provide
A) less output than what is socially optimal.
B) more output than what is socially optimal.
C) the socially optimal amount of output.
D) more output than can be absorbed by the market.
E) so little output that there will be a shortage.
Correct Answer

verified
Correct Answer
verified
Multiple Choice
The diagram below shows supply,demand,and quantity exchanged of Monday matinee movie tickets.Assume it is a perfectly competitive market.  FIGURE 12-4
-Refer to Figure 12-4.Suppose a disequilibrium price of $7.50 per movie ticket is imposed in this market.The consumer surplus becomes ________ and the producer surplus becomes ________.
A) $0; $62.50
B) $2.50; $7.50
C) $62.50; $125
D) $62.50; $250
E) $31.25; $156.25
Correct Answer

verified
Correct Answer
verified
Multiple Choice
Choose the statement that best describes the dilemma facing the regulator of a natural monopoly.
A) Marginal-cost pricing leads to profit or losses; average-cost pricing results in allocative inefficiency.
B) Marginal-cost pricing will result in allocative inefficiency; average-cost pricing leads to profits or losses.
C) Marginal-cost pricing will result in productive and allocative inefficiency; average-cost pricing will not.
D) Both kinds of regulation have the same implications for allocative efficiency.
E) There is no dilemma.
Correct Answer

verified
Correct Answer
verified
Multiple Choice
In general,which of the following statements guides policymakers with respect to a natural monopoly? The firm
A) should be broken up into a large number of competitive firms.
B) should be taken over by government and run as a crown corporation.
C) is the best way to produce a given product and should be left alone.
D) generally needs to be regulated in order to reduce allocative inefficiency.
E) will not achieve productive efficiency without regulation.
Correct Answer

verified
Correct Answer
verified
Multiple Choice
Consider the efficiency of various market structures and complete the following sentence.The larger the minimum efficient scale of firms,ceteris paribus,the
A) more likely we are to have a concentrated market and allocative inefficiency.
B) less the tendency toward monopoly inefficiency.
C) lower the advantages of large-scale production.
D) greater the number of firms comprising an industry.
E) more likely firms will display productive efficiency.
Correct Answer

verified
Correct Answer
verified
Multiple Choice
The diagram below shows the demand and supply curves in a perfectly competitive market. 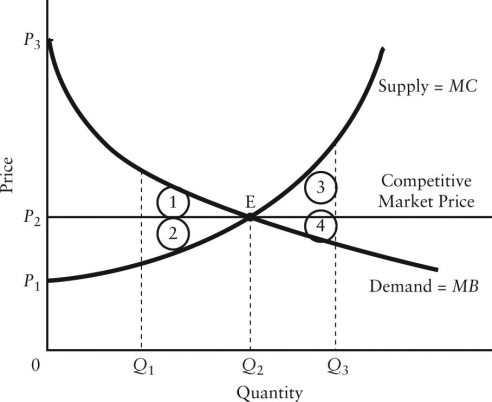 FIGURE 12-5
-Refer to Figure 12-5.If output in this market were Q3,the loss in total economic surplus relative to the competitive equilibrium would be illustrated by area
A) 1.
B) 2.
C) 3.
D) 4.
E) 3 + 4.
Correct Answer

verified
Correct Answer
verified
Multiple Choice
An allowable defence for a merger according to Canada's Competition Bureau is that
A) merging firms find it easier to decide how they will share the market.
B) merging firms are more profitable because they no longer have to compete with one another.
C) the gains in efficiency resulting from the merger more than offset any reductions in competition.
D) merged and therefore bigger firms are better placed to compete globally.
E) larger firms are easier to regulate.
Correct Answer

verified
Correct Answer
verified
Multiple Choice
Consider the following information for a regional cable television service provider that is a natural monopoly and has a U-shaped long-run average cost curve.(Assume the service provided is basic cable and units are household connections.) - minimum LRAC = $9.00 per month - minimum efficient scale = 2 million units - current output = 2.3 million units - LRAC at current output = $10.25 per month If this firm is currently being regulated and is following an average-cost pricing policy,the price of the service is ________ per month.
A) less than $9.00
B) $9.00
C) between $9.00 and $10.25
D) $10.25
E) higher than $10.25
Correct Answer

verified
Correct Answer
verified
Showing 101 - 120 of 123
Related Exams