A) It is at a zero reproduction rate.
B) Its rate of increase continues to grow at an exponential rate.
C) Its rate of growth is slowing.
D) Its rate of growth is increasing.
E) There is no scientific prediction that can be made about human population growth.
Correct Answer

verified
Correct Answer
verified
Multiple Choice
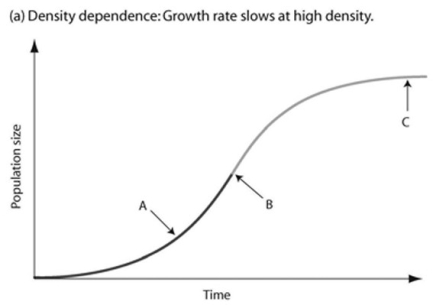
 -In the accompanying figure, which of the arrows represents the most rapid population growth?
A) arrow A
B) arrow B
C) arrow C
Correct Answer

verified
Correct Answer
verified
Multiple Choice
 -A population of ground squirrels has an annual per capita birth rate of 0.06 and an annual per capita death rate of 0.02. Calculate an estimate of the total number of individuals added to (or lost from) a population of 1000 individuals in one year.
A) 120 individuals added
B) 40 individuals added
C) 20 individuals added
D) 400 individuals added
E) 20 individuals lost
Correct Answer

verified
Correct Answer
verified
Multiple Choice
Random spacing patterns in plants such as the creosote bush are most often associated with ________.
A) chance
B) patterns of high humidity
C) the random distribution of seeds
D) competitive interaction between individuals of the same population
E) the concentration of nutrients within the population's range
Correct Answer

verified
Correct Answer
verified
Multiple Choice
 -As N approaches K for a certain population, which of the following is predicted by the logistic equation?
A) The growth rate will not change.
B) The growth rate will approach zero.
C) The population will show an Allee effect.
D) The population will increase exponentially.
E) The carrying capacity of the environment will increase.
Correct Answer

verified
Correct Answer
verified
Multiple Choice
Which of the following is the most important assumption for the mark-recapture method to estimate the size of wildlife populations?
A) All females in the population have the same litter size.
B) More individuals emigrate from, as opposed to immigrate into, a population.
C) Over 50% of the marked individuals need to be trapped during the recapture phase.
D) There is a 50:50 ratio of males to females in the population before and after trapping and recapture.
E) Marked individuals have the same probability of being recaptured as unmarked individuals during the recapture phase.
Correct Answer

verified
E
Correct Answer
verified
Multiple Choice
 -In the accompanying figure, which of the arrows represents the carrying capacity?
A) arrow A
B) arrow B
C) arrow C
D) Carrying capacity cannot be found in the figure because species under density-dependent control never reach carrying capacity.
Correct Answer

verified
Correct Answer
verified
Multiple Choice
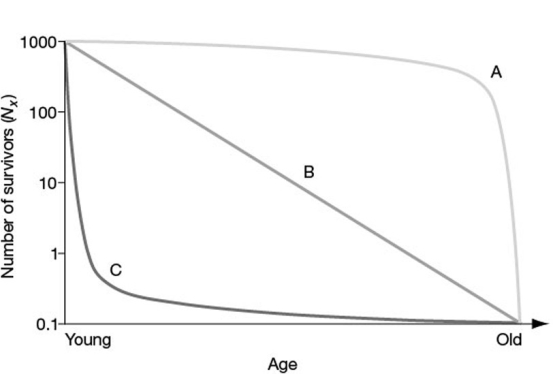
 -In the figure, which of the following survivorship curves most applies to humans living in developed countries?
A) curve A
B) curve B
C) curve C
D) curve A or curve B
Correct Answer

verified
Correct Answer
verified
Multiple Choice
The regular fluctuations in size of animal populations are termed ________. I. population cycles II. population dynamics III. growth factors
A) only I
B) only II
C) only III
D) only II and III
E) I, II, and III
Correct Answer

verified
A
Correct Answer
verified
Multiple Choice
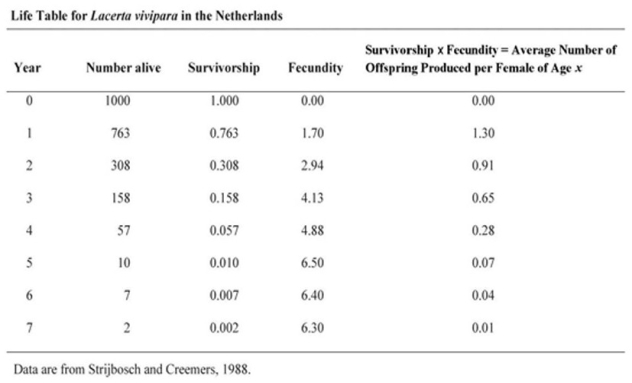
 -Using the accompanying life table, calculate the net reproductive rate (R0) for this population.
A) 2.00
B) 3.26
C) 1.30
D) 2.31
Correct Answer

verified
Correct Answer
verified
Multiple Choice
 -Using the life table, determine which age class year would hurt the population growth most if it were wiped out by disease.
A) age class year 1
B) age class year 2
C) age class year 3
D) age class year 4
E) age class year 5
Correct Answer

verified
Correct Answer
verified
Multiple Choice
Use the following abstract from Theoretical Population Biology to answer the question. Abstract: We derive measures for assessing the value of an individual habitat fragment for the dynamics and persistence of a metapopulation living in a network of many fragments. We demonstrate that the most appropriate measure of fragment value depends on the question asked. Specifically, we analyze four alternative measures: the contribution of a fragment to the metapopulation capacity of the network, to the equilibrium metapopulation size, to the expected time to metapopulation extinction and the long-term contribution of a fragment to colonization events in the network. The latter measure is comparable to density-dependent measures in general matrix population theory, though some differences are introduced by the fact that "density dependence" is spatially localized in the metapopulation context. We show that the value of a fragment depends not only on the properties of the landscape but also on the properties of the species. Most importantly, variation in fragment values between the habitat fragments is greatest in the case of rare species that occur close to the extinction threshold, as these species are likely to be restricted to the most favorable parts of the landscape. We expect that the measures of habitat fragment described and analyzed here have applications in landscape ecology and in conservation biology. Copyright © 2003 Elsevier Inc. All rights reserved. (Otso Ovaskainen and Ilkka Hanski. 2003. How much does an individual habitat fragment contribute to metapopulation dynamics and persistence? Theoretical Population Biology 64:481-95.) One measure for the value of the patch was given by the long-term contribution of a fragment to colonization events in the network. How do the properties of a landscape and the properties of a species affect the value of a patch? The value of the fragment depends ________.
A) on the properties of the landscape and the properties of the species
B) only on the properties of the landscape and not on the properties of the species
C) not on the properties of the landscape but only on the properties of the species
D) on neither the properties of the landscape nor on the properties of the species
Correct Answer

verified
Correct Answer
verified
Multiple Choice
The study of factors that determine the size and structure of populations through time is called ________.
A) community ecology
B) immigration biology
C) demography
D) logistic growth
Correct Answer

verified
Correct Answer
verified
Multiple Choice
 -Which statements about K are correct?
I. K varies among populations.
II. K varies in space.
III. K varies in time.
IV. K is constant for any given species.
A) only I and III
B) only II and IV
C) only I, II, and III
D) only II, III, and IV
E) only I, II, and IV
Correct Answer

verified
Correct Answer
verified
Multiple Choice
During exponential growth, a population always ________.
A) grows by thousands of individuals
B) grows at its maximum per capita rate
C) quickly reaches its carrying capacity
D) cycles through time
E) loses some individuals to emigration
Correct Answer

verified
Correct Answer
verified
Multiple Choice
Which of the following examples would most accurately measure the density of the population being studied?
A) counting the number of prairie dog burrows per hectare
B) counting the number of times a 1-kilometer transect is intersected by tracks of red squirrels after a snowfall
C) counting the number of coyote droppings per hectare
D) counting the number of moss plants in 1-square-meter quadrants
E) counting the number of zebras from airplane census observations.
Correct Answer

verified
Correct Answer
verified
Multiple Choice
To measure the population of lake trout in a 250-hectare lake, 400 individual trout were netted and marked with a fin clip, then returned to the lake. The next week, the lake was netted again, and out of the 200 lake trout that were caught, 50 had fin clips. Using the mark-recapture estimate, the lake trout population size could be closest to which of the following?
A) 160
B) 200
C) 400
D) 1600
E) 80,000
Correct Answer

verified
D
Correct Answer
verified
Multiple Choice
Why can't a female lizard have both high fecundity and high survival?
A) In only rare cases, do lizards have both high fecundity and high survival.
B) Female lizards are able to produce only one set of offspring.
C) Competition for resources prevents this.
D) The more energy the female devotes to offspring, the less that can be devoted to her survival.
E) The female is already maximizing the number of eggs she lays, and if she attempts to nest later in the season, there will not be enough food for her young.
Correct Answer

verified
Correct Answer
verified
Multiple Choice
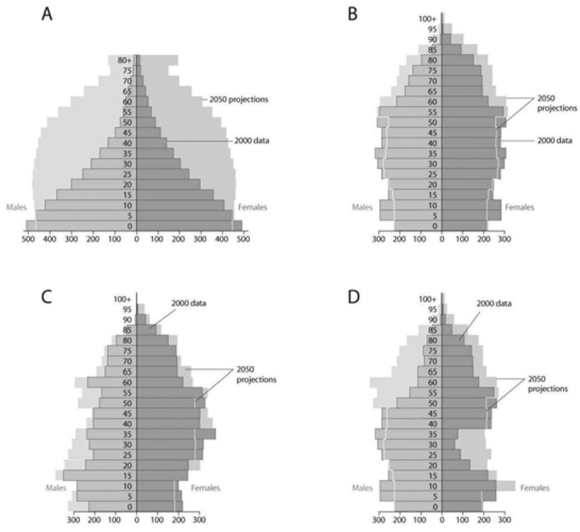
 Based on the diagrams in the figure shown and on the large population of baby boomers in the United States, which graph best reflects U.S. population in 20 years?
A) A
B) B
C) C
D) D
Correct Answer

verified
Correct Answer
verified
Multiple Choice
It is estimated that a flock of wood buffalo crane should be able to sustain an r of 0.085 for the foreseeable future. If the flock currently contains 350 individuals, how long will it take for that population to double?
A) between 7.0 and 9.0 years
B) between 9.0 and 11.0 years
C) between 11.0 and 13.0 years
D) less than 7 years
E) more than 13 years
Correct Answer

verified
Correct Answer
verified
Showing 1 - 20 of 57
Related Exams