Correct Answer

verified
Correct Answer
verified
Multiple Choice
Refer to the information provided in Figure 3.11 below to answer the following questions. 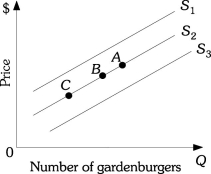 Figure 3.11
-Refer to Figure 3.11. An increase in the wage rate of gardenburger makers will cause a movement from Point B on supply curve S2 to
A) Point A on supply curve S2.
B) Point C on supply curve S2.
C) supply curve S3.
D) supply curve S1.
Correct Answer

verified
Correct Answer
verified
Multiple Choice
Refer to the information provided in Figure 3.1 below to answer the questions that follow. 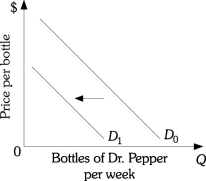 Figure 3.1
-Refer to Figure 3.1. Which of the following would be most likely to cause the demand for Dr. Pepper to shift from D0 to D1?
A) a decrease in income, assuming that Dr. Pepper is a normal good
B) an increase in the price of 7-UP, assuming 7-UP is a substitute for Dr. Pepper
C) a decrease in the price of Dr. Pepper
D) a reduction in the price of sugar used to make Dr. Pepper
Correct Answer

verified
Correct Answer
verified
Multiple Choice
Refer to the information provided in Figure 3.7 below to answer the following questions. 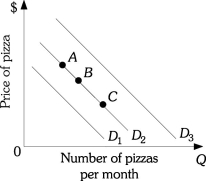 Figure 3.7
-Refer to Figure 3.7. If pizza and burritos are substitutes, a decrease in the price of burritos will cause a movement from Point B on demand curve D2 to
A) demand curve D1.
B) demand curve D3.
C) Point A on demand curve D2.
D) Point C on demand curve D2.
Correct Answer

verified
Correct Answer
verified
Multiple Choice
Refer to the information provided in Figure 3.18 below to answer the questions that follow. 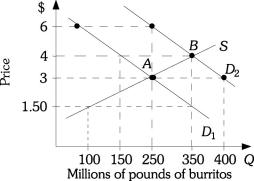 Figure 3.18
-Refer to Figure 3.18 The market is initially in equilibrium at Point B. If demand shifts from D2 to D1 and the price of burritos remains constant at $4.00, there will be
A) an excess supply of 200 million pounds of burritos.
B) an excess demand of 200 million pounds of burritos.
C) an excess supply of 100 million pounds of burritos.
D) an excess demand of 100 million pounds of burritos.
Correct Answer

verified
Correct Answer
verified
Multiple Choice
Refer to the information provided in Figure 3.13 below to answer the questions that follow. 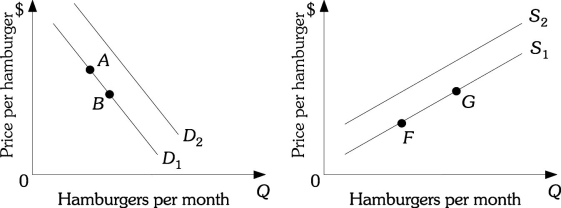 Figure 3.13
-Refer to Figure 3.13. A decrease in the number of cattle ranchers will cause a movement from
A) Point A to Point B.
B) Point G to Point F.
C) D2 to D1.
D) S1 to S2.
Correct Answer

verified
Correct Answer
verified
True/False
A change in the price of a good leads to a change in the demand of the good.
Correct Answer

verified
Correct Answer
verified
Multiple Choice
For inferior goods, demand will fall when
A) income increases.
B) income decreases.
C) price increases.
D) price decreases.
Correct Answer

verified
Correct Answer
verified
Multiple Choice
If the market for tires is unregulated and is presently characterized by excess supply, you can accurately predict that price will
A) increase, the quantity demanded will fall, and the quantity supplied will rise.
B) increase, the quantity demanded will rise, and the quantity supplied will fall.
C) decrease, the quantity demanded will rise, and the quantity supplied will fall.
D) decrease, the quantity demanded will fall, and the quantity supplied will rise.
Correct Answer

verified
Correct Answer
verified
Multiple Choice
Refer to the information provided in Figure 3.2 below to answer the questions that follow. 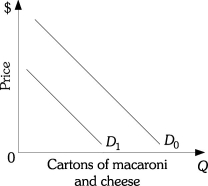 Figure 3.2
-If the demand for sardines increases as income decreases, sardines are a(n)
A) normal good.
B) inferior good.
C) substitute good.
D) complementary good.
Correct Answer

verified
Correct Answer
verified
Multiple Choice
Refer to the information provided in Figure 3.16 below to answer the questions that follow. 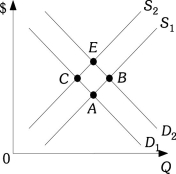 Figure 3.16
-Refer to Figure 3.16. When the economy moves from Point B to Point A, there has been
A) an increase in supply and a decrease in quantity demanded.
B) a decrease in both supply and demand.
C) a decrease in demand and a decrease in quantity supplied.
D) a decrease in supply and a decrease in quantity demanded.
Correct Answer

verified
Correct Answer
verified
Multiple Choice
Refer to the information provided in Table 3.2 below to answer the questions that follow.
Table 3.2
 -Refer to Table 3.2. In this market there will be an excess supply of 500 cheeseburgers at a price of
A) $5.
B) $6.
C) $8.
D) $9.
Correct Answer

verified
Correct Answer
verified
Multiple Choice
Refer to Scenario 3.3 below to answer the questions that follow. SCENARIO 3.3: Mustard and mayonnaise are substitutes. Mustard and relish are complements. Mustard is a normal good. During the summer, about 50% of all mustard was recalled by manufacturers and removed from store shelves. -Refer to Scenario 3.3. As a result of the recall, you would expect that
A) the supply of mustard would decrease, the price of mustard would increase, and the demand for mustard would decrease.
B) the price of mustard would increase, the supply of mustard would increase, and the quantity demanded of mustard would decrease.
C) the supply of mustard would decrease, the price of mustard would increase, and the quantity demanded of mustard would decrease.
D) the price of mustard would increase and both the quantity of mustard supplied and the quantity of mustard demanded would increase.
Correct Answer

verified
Correct Answer
verified
True/False
A technological advance in the production of MP3 players will cause the equilibrium selling price to increase.
Correct Answer

verified
Correct Answer
verified
Multiple Choice
If the price of spinach decreases, there will be ________ of spinach enchiladas.
A) an increase in the supply
B) a decrease in the supply
C) an increase in the quantity supplied
D) a decrease in the quantity supplied
Correct Answer

verified
Correct Answer
verified
Multiple Choice
The price of circuit boards used in the manufacturing of LCD televisions has fallen. This will lead to ________ LCD televisions.
A) an increase in the supply of
B) a decrease in the supply of
C) an increase in the quantity supplied of
D) a decrease in the quantity supplied of
Correct Answer

verified
Correct Answer
verified
Multiple Choice
Suppose that iPhones are normal goods. If the income of iPhone users decreases, you predict that in the market for iPhones
A) both equilibrium price and quantity will fall.
B) both equilibrium price and quantity will increase.
C) equilibrium price will increase and quantity will decrease.
D) equilibrium price will fall but quantity will increase.
Correct Answer

verified
Correct Answer
verified
Multiple Choice
A new fertilizer which greatly improves the corn crop yield is being widely used by corn farmers. You accurately predict that this
A) will shift the supply curve of corn to the right, the equilibrium price of corn will increase, and the demand for corn will fall.
B) will shift the supply curve of corn to the right, the equilibrium price of corn will decrease, and the quantity demanded of corn will increase.
C) will shift the supply curve of corn to the left, the equilibrium price of corn will increase, and the quantity demanded of corn will decrease.
D) will shift the supply curve of corn to the left, the equilibrium price of corn will increase, and the demand for corn will fall.
Correct Answer

verified
Correct Answer
verified
Multiple Choice
Refer to the information provided in Figure 3.1 below to answer the questions that follow.  Figure 3.1
-Refer to Figure 3.1. Which of the following would be most likely to cause the demand for Dr. Pepper to shift from D0 to D1?
A) an increase in income, assuming that Dr. Pepper is a normal good
B) a decrease in the price of 7-UP, assuming 7-UP is a substitute for Dr. Pepper
C) an increase in the price of Dr. Pepper
D) an increase in the price of sugar used to make Dr. Pepper
Correct Answer

verified
Correct Answer
verified
True/False
If price is above the equilibrium, there will be excess supply of the product.
Correct Answer

verified
Correct Answer
verified
Showing 41 - 60 of 298
Related Exams