Asked by
Madeline Villalona
on Nov 12, 2024
Verified
The following graph shows the market equilibrium for corn in the United States.If the world price of corn is $6 and there are no trade restrictions,the United States will:
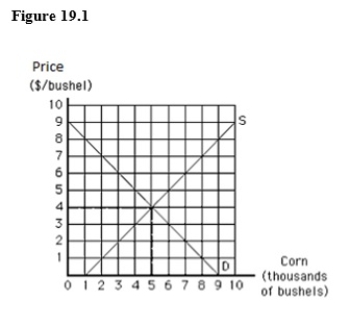
A) produce 7,000 bushels of corn,consume 3,000 bushels of corn,and import 4,000 bushels of corn.
B) produce 7,000 bushels of corn,consume 3,000 bushels of corn,and export 4,000 bushels of corn.
C) have an excess demand for corn.
D) produce 3,000 bushels of corn,consume 7,000 bushels of corn,and import 4,000 bushels of corn.
E) produce 3,000 bushels of corn,consume 7,000 bushels of corn,and export 4,000 bushels of corn.
World Price
The global market price of a commodity, determined by supply and demand factors across all participating countries.
Market Equilibrium
A situation in economics where the quantity of goods supplied is equal to the quantity of goods demanded at a specific price.
Trade Restrictions
measures taken by governments to control or limit the trade of goods and services across their borders, such as tariffs and quotas.
- Comprehend the impacts international trade has on a nation's total imports or exports, contingent upon global pricing along with domestic demand and supply dynamics.

Verified Answer
NR

Learning Objectives
- Comprehend the impacts international trade has on a nation's total imports or exports, contingent upon global pricing along with domestic demand and supply dynamics.